. 2010 Dec 30;5(12):e15323.
doi: 10.1371/journal.pone.0015323.

Global patterns and predictions of seafloor biomass using random forests

Affiliations

Global patterns and predictions of seafloor biomass using random forests

Chih-Lin Wei et al. PLoS One. .

Abstract

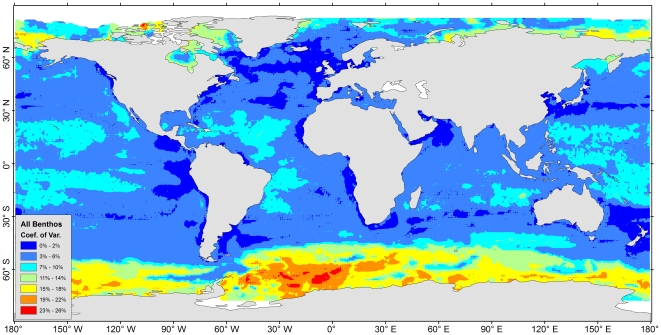
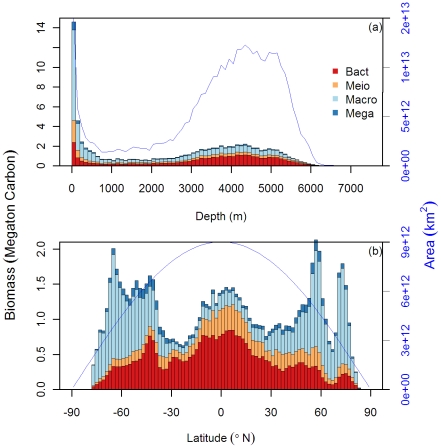
A comprehensive seafloor biomass and abundance database has been constructed from 24 oceanographic institutions worldwide within the Census of Marine Life (CoML) field projects. The machine-learning algorithm, Random Forests, was employed to model and predict seafloor standing stocks from surface primary production, water-column integrated and export particulate organic matter (POM), seafloor relief, and bottom water properties. The predictive models explain 63% to 88% of stock variance among the major size groups. Individual and composite maps of predicted global seafloor biomass and abundance are generated for bacteria, meiofauna, macrofauna, and megafauna (invertebrates and fishes). Patterns of benthic standing stocks were positive functions of surface primary production and delivery of the particulate organic carbon (POC) flux to the seafloor. At a regional scale, the census maps illustrate that integrated biomass is highest at the poles, on continental margins associated with coastal upwelling and with broad zones associated with equatorial divergence. Lowest values are consistently encountered on the central abyssal plains of major ocean basins The shift of biomass dominance groups with depth is shown to be affected by the decrease in average body size rather than abundance, presumably due to decrease in quantity and quality of food supply. This biomass census and associated maps are vital components of mechanistic deep-sea food web models and global carbon cycling, and as such provide fundamental information that can be incorporated into evidence-based management.


Conflict of interest statement

Competing Interests: The authors have declared that no competing interests exist.

Figures

Figure 1
Figure 1. Distribution of abundance and biomass records in the “CoML Fresh Biomass Database”.
References and locations for each size class are given in Appendix S1 and File S1. Bathymetric layer uses NOAA ETOPO 1 Global Relief Model .
Figure 2
Figure 2. Biomass as a function of depth for bacteria, meiofauna, macrofauna, and megafauna.
Biomass was log10 transformed and the effects of latitude and longitude were removed by partial regression. Figure legend follows Rex et al. for comparison. References of data source are available in Appendix S1 and File S1. Regression equations and test statistics for each size categories are available in Table 2.
Figure 3
Figure 3. Abundance as a function of depth for bacteria, meiofauna, macrofauna, and megafauna.
Abundance was log10 transformed and the effects of latitude and longitude were removed by partial regression. Figure legend follows Rex et al. for comparison. References of data source are available in Appendix S1 and File S1. Regression equations and test statistics for each size category are available in Table 2.
Figure 4
Figure 4. Average body size as a function of depth for bacteria, meiofauna, macrofauna, and megafauna.
The average size was calculated by dividing biomass with abundance. The body size was log10 transformed and the effects of latitude and longitude were removed by partial regression. Figure legend follows Rex et al. for comparison. References of data source are available in Appendix S1 and File S1. Regression equations and test statistics for each size categories are available in Table 2.
Figure 5
Figure 5. Random Forests (RF) performance on biomass and abundance of each size class.
(a) Mean percent variance explained by the RF model ± S.D. (error bar) from 4 RF simulations. Abbreviations: Bact  =  bacteria, Meio  =  meiofauna, Macro  =  macrofauna, Mega  =  megafauna, and invert  =  invertebrates. (b) Observed against OOB predicted biomass from the 4 RF simulations. Color legends indicate 4 major size classes.
Figure 6
Figure 6. Mean predictor Importance on total seafloor biomass.
The predictor importance of major size classes were combined (Figure S3) and mean ± S.D. (error bar) was calculated from 4 RF simulations. The top 20 most important variables are shown in descending order. Increase of mean square error (MSEOOB) indicates the contribution to RF prediction accuracy for that variable.
Figure 7
Figure 7. Distribution of seafloor biomass predictions.
The total biomass was combined from predictions of bacteria, meiofauna, macrofauna, and megafauna biomass (Figure S5a, b, c, d). Map was smoothed using Inverse Distance Weighting interpolation to 0.1 degree resolution and displayed in logarithm scale (base of 10).
Figure 8
Figure 8. Coefficient of variation (C.V.) for mean seafloor biomass prediction.
The C.V. was computed as S.D./mean * 100% from 4 RF simulations. Map was smoothed using Inverse Distance Weighting interpolation to 0.1 degree resolution.
Figure 9
Figure 9. Global zonal integrals of benthic biomass (bars) in unit of megaton carbon based on 100-m bins (a) and 2-latitude-degree bins (b).
The blue line shows integrals of seafloor area in unit of square kilometer. Color legends indicate 4 major size classes.
Figure 10
Figure 10. Seafloor biomass predictions against depths for the (a) Atlantic Ocean, (b) Pacific Ocean, (c) Indian Ocean, (d) Southern Ocean, (e) Arctic Ocean, (f) Mediterranean Sea, and (g) Gulf of Mexico.
Blue color gradient indicates kernel density estimates. Panel (h) shows the regional predicted trends based on smoothing spline function. Color legend indicates the spline trends for each basin.

References

    1. Rowe GT, Wei C-L. Biodiversity of Deep-Sea Macrofauna as a Function of Food Supply. In preparation.
    1. Rex M, Etter R. Cambridge, MA: Harvard University Press; 2010. Deep-sea biodiversity: pattern and scale.354
    1. Petersen CGJ. The sea-bottom and its production of fish-food. Report of the Danish Biological Station. 1918;25:1–62.
    1. Petersen CGJ. Valuation of the sea, Part 2. The animal communities of the sea-bottom and their importance for marine zoogeography. Report of the Danish Biological Station. 1913;21:1–43.
    1. Holme N, McIntyre A. Oxford, UK: Blackwell; 1971. Methods for the study of marine benthos. IBP Handbook No. 16.

Publication types