. 2010 Dec 30;5(12):e14455.
doi: 10.1371/journal.pone.0014455.

Intrinsic activity in the fly brain gates visual information during behavioral choices

Affiliations

Intrinsic activity in the fly brain gates visual information during behavioral choices

Shiming Tang et al. PLoS One. .

Abstract

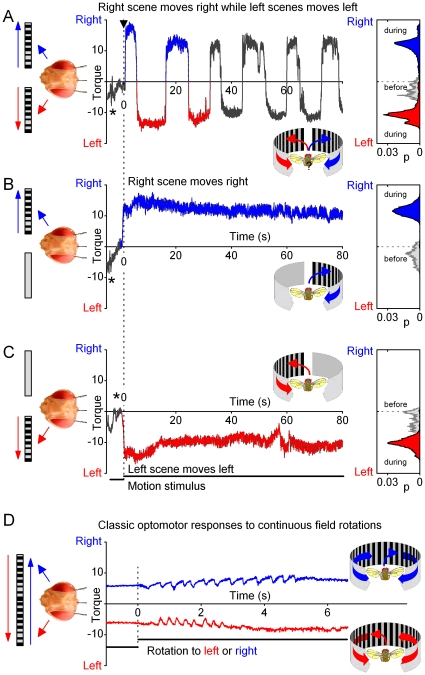
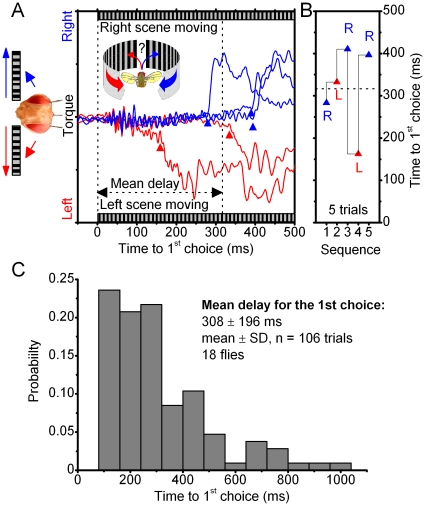
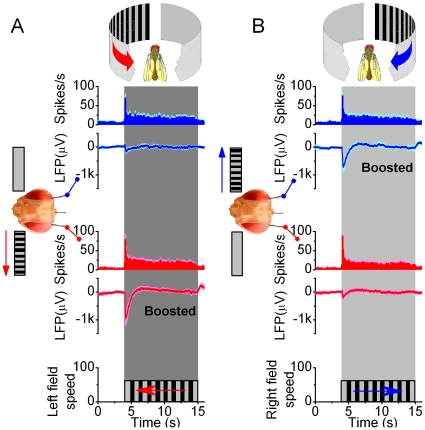
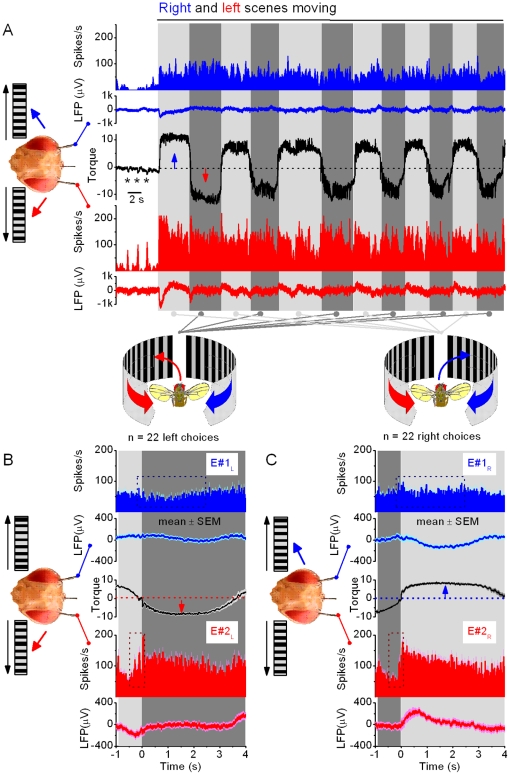
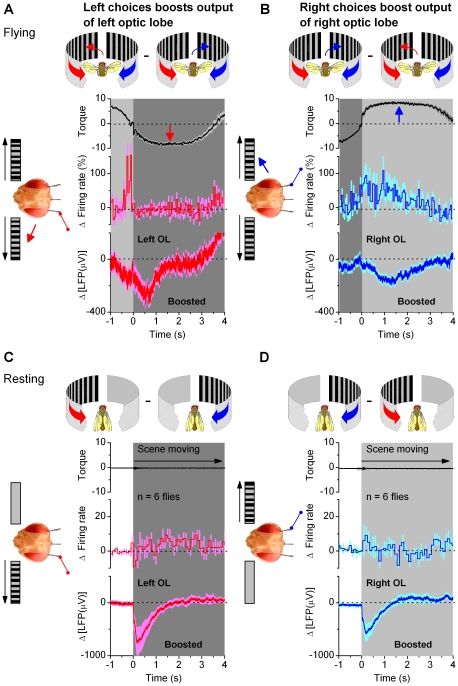
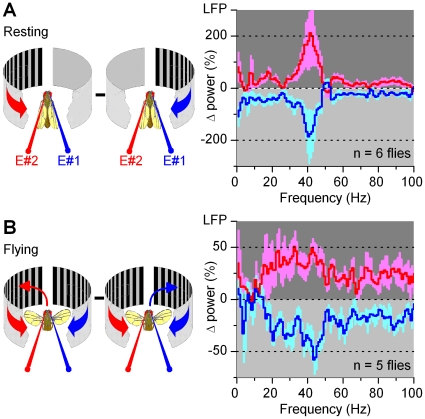
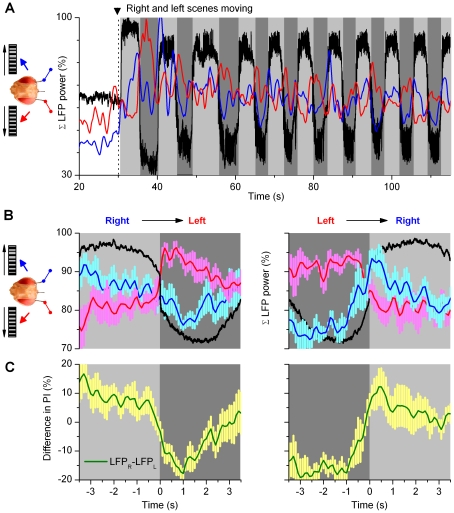
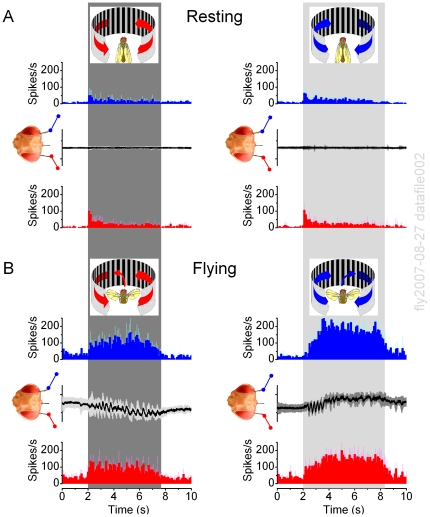
The small insect brain is often described as an input/output system that executes reflex-like behaviors. It can also initiate neural activity and behaviors intrinsically, seen as spontaneous behaviors, different arousal states and sleep. However, less is known about how intrinsic activity in neural circuits affects sensory information processing in the insect brain and variability in behavior. Here, by simultaneously monitoring Drosophila's behavioral choices and brain activity in a flight simulator system, we identify intrinsic activity that is associated with the act of selecting between visual stimuli. We recorded neural output (multiunit action potentials and local field potentials) in the left and right optic lobes of a tethered flying Drosophila, while its attempts to follow visual motion (yaw torque) were measured by a torque meter. We show that when facing competing motion stimuli on its left and right, Drosophila typically generate large torque responses that flip from side to side. The delayed onset (0.1-1 s) and spontaneous switch-like dynamics of these responses, and the fact that the flies sometimes oppose the stimuli by flying straight, make this behavior different from the classic steering reflexes. Drosophila, thus, seem to choose one stimulus at a time and attempt to rotate toward its direction. With this behavior, the neural output of the optic lobes alternates; being augmented on the side chosen for body rotation and suppressed on the opposite side, even though the visual input to the fly eyes stays the same. Thus, the flow of information from the fly eyes is gated intrinsically. Such modulation can be noise-induced or intentional; with one possibility being that the fly brain highlights chosen information while ignoring the irrelevant, similar to what we know to occur in higher animals.


Conflict of interest statement

Competing Interests: The authors have declared that no competing interests exist.

Figures

Figure 1
Figure 1. Open loop experiments for measuring a Drosophila's orienting behavior (torque responses) to competing stimuli.
(A) Schematic drawing of the flight simulator system. Two identical paper strips, having the same black and white stripe pattern, curve along the surface of a transparent cylinder on the left (red) and right (blue) of a tethered flying fly, thus forming the left and right scenes, respectively. The scenes are moved by an electrical motor. The yaw torque of the fly, i.e. its responses toward the moving scenes, is measured by an opto-mechanical torque meter. A small mirror linearly reflects changes in the yaw torque; the light-return of a laser beam over distance greatly amplifies this signal for an optical sensor. (B) Because the fly's head is clamped in a fixed position and orientation, preventing its movements, the fly should see two identical scenes, on its left and right, which simultaneously move to the opposite directions without any overlapping visual fields. Thus, this stimulation generates two isolated monocular flow fields, one for each eye. The fly's torque response indicates which of the two stimuli (moving scenes) it has chosen to pursue at any one time.
Figure 2
Figure 2. Drosophila's behavior to competing left and right visual motion stimuli.
(A) A flying tethered Drosophila faces two identical scenes of black and white stripes, one on its left and the other on its right, in a flight simulator system. When the scenes are still, a fly often generates brief saccades (stars), characteristic of normal exploratory behavior , but orients mostly straight. When the scenes are set to sweep together to the opposing directions (dotted line, at time zero), a fly's attempts to rotate (yaw torque) toward the left (red trace) or right (blue trace) stimulus begin to flip from side to side with switch-like dynamics, as measured by the torque meter. Throughout these strong responses, the visual input to the fly's eyes remains virtually unchanged, because the fly's head is firmly held by the torque meter in a fixed position. The behavior consists of stereotypical one-sided torque responses, which last 5–15 s, yet their duration and patterning varies greatly from fly to fly (cf. Figs. 6, S3 and S6). The torque responses of a Drosophila to right (up) or left (down) during bilaterally moving scenes (A) are of similar strength to its responses when the right (B) or left (C) scenes are moved separately. The insets show the corresponding probability density functions before and during the motion stimulation. Thus, with competing stimuli (A), Drosophila appears to choose one scene at a time and exert its yaw torque according to it, before switching to the opposite stimulus. (D) The classical optomotor responses of a fly look different. Tethered to the same torque meter, a flying fly was exposed to 360° visual field (having similar black and white stripes, as above) that rotated left or right. A fly tries to stabilize its vision by attempting to turn into the same direction as the rotating stimulus. The resulting optomotor responses, which contain correction saccades, are typically evoked from the stimulus onset onwards, characteristic of steering reflexes. They are also much smaller than the torque responses to stimuli in A–C. Note the 10-times briefer time scale in D. The optomotor responses in D are shifted up and down to highlight their waveforms. Torque is in arbitrary units.
Figure 3
Figure 3. Time-to-choice varies greatly during competing stimulation.
(A) A tethered fly is flying in the flight arena, when suddenly the identical scenes on its left and right, are made to move together at the moment of t = 0 (60°/s). It takes on average 316.6±100.4 ms (mean ± SD, n = 5) before the fly begins to react either to the left (red triangle) or right (blue triangle) scene, as measured by time-to-choice of its first switch-like torque responses. The scenes were stopped and started again with tens of seconds between the trials. These orientation responses are highly variable. The double-headed arrow (black) stretches out the mean delay for this fly. (B) Its first responses were either to left (red triangle) or right (blue triangle), showing no side-preference and with time-to-onset, or wait-period, varying from one trial to another (14/18 flies behaved this way). Other flies preferred one stimulus over its counterpart, yet the wait-period for their first switch-like torque response changed greatly between the trials (4/18 flies behaved this way). The experimental settings were kept identical, but the flies “motivation” to perform varied greatly. In the worst case, we could only test this paradigm twice, before the fly lost “interest” and stopped flying. In the best case, the experiment was repeated 20 times. (C) Time-to-choice statistics of the flies are skewed with a heavy tail. As there was no real difference in the variable onset between the left and right responses, these results are pooled. Notice, that sometimes it took a fly for over a second to initiate orientation toward its chosen stimulus.
Figure 4
Figure 4. Brain activity increases on the side facing the motion stimulus.
Local field potentials (LFPs) in the left and right optic lobes of resting Drosophila are enhanced on the side of the moving scene (black and white stripes), whereas the firing patterns show that unilateral visual motion is processed bilaterally in the brain. (A) Neurons in both the right (blue traces) and left (red traces) optic lobes respond simultaneously and adapt rapidly to left motion; this transiently increases their firing rates, amplifying the LFPs. Peak rates: 69.6±29.0 and 79.0±38.0 spikes/s (mean ± SD; right and left electrode, respectively) show no statistical difference, whilst left LFPs are always larger (p = 0.006; ANOVA, one-way Bonferreoni test). (B) Similarly, neurons in both optic lobes respond to right motion. Peak rates: 75.3±28.7 and 87.9±40.4 spikes/s (mean ± SD; right and left electrode, respectively) do not differ statistically, but the right LFPs are always larger (p = 0.012, ANOVA, one-way Bonferreoni test). Without motion stimulus the activity is low: 5.2±1.3 spikes/s (mean ± SD; n = 12). The strong motion-sensitivity suggests that the electrodes reside in the lobula plates. Scenes were separately moved for 6–20 times on either side with 5–10 s interstimulus periods; means ± SEMs shown, n = 6 flies.
Figure 5
Figure 5. Neural output of the optic lobes to moving stimuli precedes behavioral choices.
This figure shows five trials of a single fly in the competing stimuli paradigm. (A) A flying tethered Drosophila has three electrodes inserted into its brain: right (E#1) and left (E#2) optic lobes (OL) and reference (Ref). It flies in a flight simulator seeing identical scenes of black and white stripes on its left and right. (B) When the scenes are still, the fly continues flying strength, and the right and left optic lobes show little activity; only a sporadic spike and the local field potentials (LFPs) are flat (E#2, blue traces; E#1 red traces). (C) When the scenes start to sweep to the opposing directions (ft = 0), it takes about 20 ms (yellow) for the optic lobes to respond to these visual stimuli (first spikes, and dips in LFPs). However, the fly still only makes little adjustments in its flight path, i.e. the yaw torque remains flat. (D) After minimum of 210 ms of stimulation, the fly finally chooses the left stimulus by attempting to turn left (gray area), seen as intensifying yaw torque (downward). The fly's choice of stimulus (left) is taken from the point where a new clear trajectory starts in the torque response, crossing the midline. The time to 1st-choice varies greatly; thick black traces show trials where the fly took 375 and 700 ms to choose the stimulus. In the presented fast time scale, the changes in the yaw torque show no obvious influence on the neural outputs of the optic lobes. Recordings like this imply that the early neural activity in the optic lobes is predominantly evoked by visual motion. Thus, here it appears neither induced by, nor corresponds to, stimulus artifacts or flight muscle activity. LFPs show means ± SDs.
Figure 6
Figure 6. Neural output of the optic lobes is modulated with behavioral choices.
(A) A flying tethered Drosophila faces identical scenes of black and white stripes on its left and right. When the scenes are still, the fly generates exploratory saccades (stars). When the scenes move to opposing directions, the fly's yaw torque (black) begins eventually to flip between right and left. These behavioral choices of the fly are accompanied with an increased oscillating neural activity both sides of its brain (firing rates and LFPs; blue traces: right electrode, E#1 and red traces: left electrode, E#2). Each choice (or switch-like torque response) can be separated from its neighbors by its clean zero-crossings. Torque responses to right are shown in light gray, and those to left in dark gray. (B–C) show statistics of the neural activity in the left and right LPs for left and right torque responses, respectively (mean ± SEM, n = 22 choices to both directions). The traces were aligned in respect to the corresponding zero-crossings (dotted lines) in the torque signals (black traces). This data was then used for estimating intrinsic modulation (Figs. 7A–B) as the change in the activity of the right optic lobe: E#1 (right torque) – E#1 (left torque); and for the left optic lobe: E#2 (left torque) – E#2 (right torque). For firing rates, the bin-size is 100 ms; torque is in arbitrary units. The dotted boxes in B and C focus on the largest differences in the firing rate in each optic lope for left and right choices.
Figure 7
Figure 7. Neural output of the optic lobes increases on the side chosen for torque response.
Changes (Δ) in the average transmission of visual motion information are shown for opposing choices (A, B; relative change for firing rates) in flying flies, and for opposing visual stimuli (C, D) in resting flies. Despite seeing equal but opposite motion stimuli (moving scenes of black and white stripes) on its left and right, the activity of the optic lobes changes when a fly chooses the stimulus for its torque response to (A, B) as if the left and right scenes were presented alternatingly to the fly at rest (C, D). (A) Choosing the left stimulus (torque down) boosts the output of the left optic lobe; (B) choosing the right stimulus (up) boosts the output of the right. This data, aligned by the zero-crossings (dotted) in the torque (top) with left/right division (dark/light grey), is from an experiment containing 22 nearly symmetrical choices (switch-like torque responses) to left and right in Figs. 6B–C. Changes in firing rates and LFPs in the left (red) and right (blue) optic lobes, shown when a fly chooses ipsi- and contralateral sides, respectively. (C, D) At rest (zero-torque): left stimulus boosts LFP of the left optic lobe more than right stimulus (C, bottom); the right optic lobe also prefers ipsilateral stimulation (D, bottom). Due to the one-sided stimulation of step-like movements, these differences are larger and more transient than when a fly's chooses between the stimuli (A, B). Mean firing (C, D, middle) shows less modulation as averaging cancels out ipsi/contralateral preferences of individual sites (cf. Fig. S8A). The data in (C, D) is from 6 flies in Fig. 4. Torque, arbitrary units; means ± SEMs shown.
Figure 8
Figure 8. Neural activity (LFPs) increases at gamma-frequencies.
Relative changes (Δ) in power spectra of neural activity in the optic lobes, when: (A) a moving screen of black and white stripes is presented to a resting fly or (B) when a fly chooses it (torque response toward it). Traces show mean ± SEM for the relative changes in LFPs pooled from experiments in different flies; E#1 and E#2 are the right and left electrodes. When presented with, or choosing, ipsilateral motion stimulus, the power spectrum of LFP in one LP increases by 20–200% between 20–100 Hz over its corresponding power spectrum for contralateral stimulus; maxima between 20–50 Hz (i.e. gamma-band). For details of the calculations and individual experiments, see Fig. S9.
Figure 9
Figure 9. Drosophila brain gates the flow of visual information from the eyes.
(A) A fly faces identical screens of black and white stripes on its left and right, and we measure the outputs of its left (red) and right (blue) optic lobes, as power-indexes (20–100 Hz frequencies) of their LFPs. When the scenes are set to motion, the left and right power indexes oppose each other (i.e. these are 180° phase shifted), alternating in synchrony with the orienting behavior (black). Light grey sections highlight switch-like torque responses to right; dark grey sections to left. Notice also the effect of saliency in the power index; the overall neural activity settles down from the initial maxima as the fly continues choosing between the stimuli. (B) The behavior-triggered average of the right (blue) and left (red) optic lobe's power-indexes during right-to-left and left-to-right torque responses (black); torque, arbitrary units. When a fly's orienting flips sides, its brain activity is readily enhanced on the chosen side but more gradually suppressed on the opposite side. (C) The difference in power-indexes (green) predicts the behavior in (B). Mean ± SEM of 5 flies. For details of the calculations and individual experiments, see Fig. S10.
Figure 10
Figure 10. Neural activity in the optic lobes, as measured by our miniature electrodes, depends on the fly's behavioral state.
(A) Firing activity in the left (red) and right (blue) optic lobes of a resting fly to leftward and rightward field rotation. (B) Neural firing in the optic lobes of the same fly, but when flying, to leftward and rightward field rotation, which initiates corresponding optomotor responses (black). Neural activity in the optic lobes can increase 2-3-fold when flying. (Mean ± SD, n = 5 trials in each experiment). Torque in arbitrary units.

References

    1. Faisal AA, Selen LP, Wolpert DM. Noise in the nervous system. Nat Rev Neurosci. 2008;9:292–303. - PMC - PubMed
    1. Poulet JF, Hedwig B. The cellular basis of a corollary discharge. Science. 2006;311:518–522. - PubMed
    1. Poulet JF, Hedwig B. A corollary discharge maintains auditory sensitivity during sound production. Nature. 2002;418:872–876. - PubMed
    1. Webb B. Neural mechanisms for prediction: do insects have forward models? Trends Neurosci. 2004;27:278–282. - PubMed
    1. Osborne LC, Lisberger SG, Bialek W. A sensory source for motor variation. Nature. 2005;437:412–416. - PMC - PubMed

Publication types