. 2010 Dec 28;5(12):e15245.
doi: 10.1371/journal.pone.0015245.

Formation and toxicity of soluble polyglutamine oligomers in living cells

Affiliations

Formation and toxicity of soluble polyglutamine oligomers in living cells

Patrick Lajoie et al. PLoS One. .

Abstract

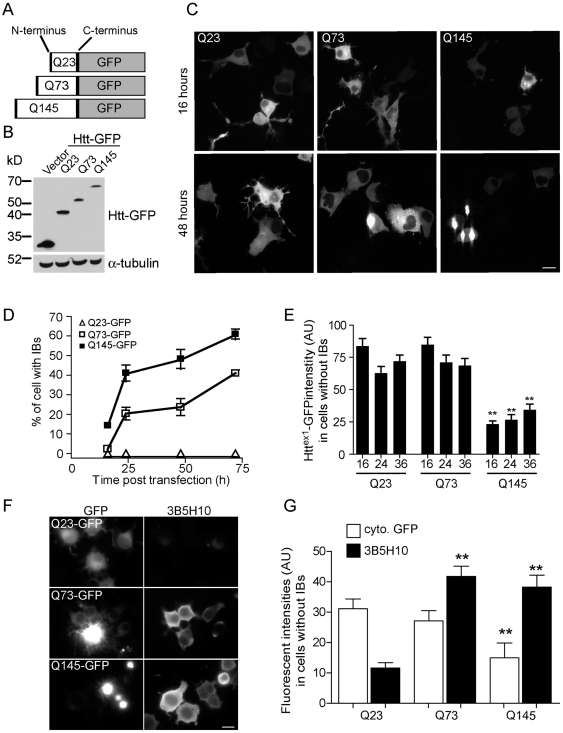
Background: Aggregation and cytotoxicity of mutant proteins containing an expanded number of polyglutamine (polyQ) repeats is a hallmark of several diseases, including Huntington's disease (HD). Within cells, mutant Huntingtin (mHtt) and other polyglutamine expansion mutant proteins exist as monomers, soluble oligomers, and insoluble inclusion bodies (IBs). Determining which of these forms constitute a toxic species has proven difficult. Recent studies support a role for IBs as a cellular coping mechanism to sequester levels of potentially toxic soluble monomeric and oligomeric species of mHtt.

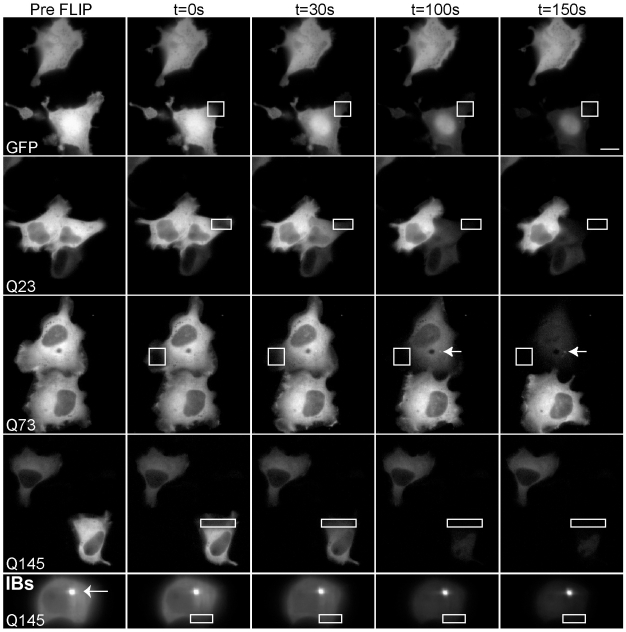
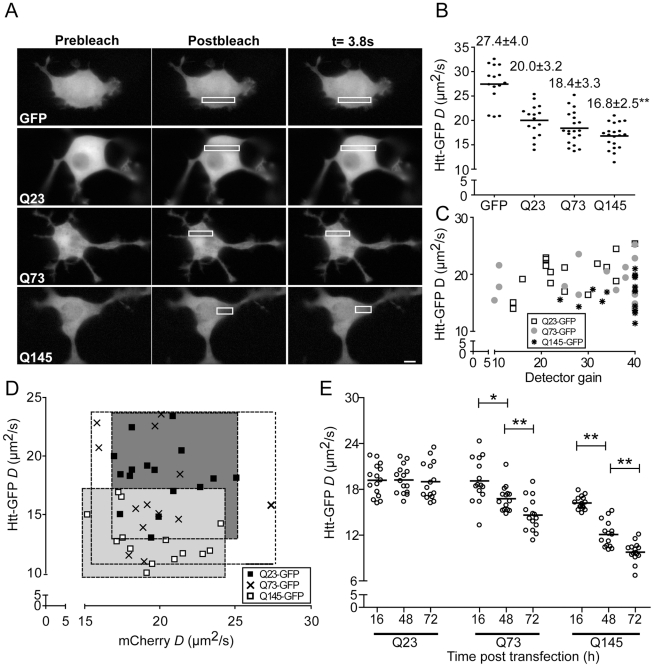
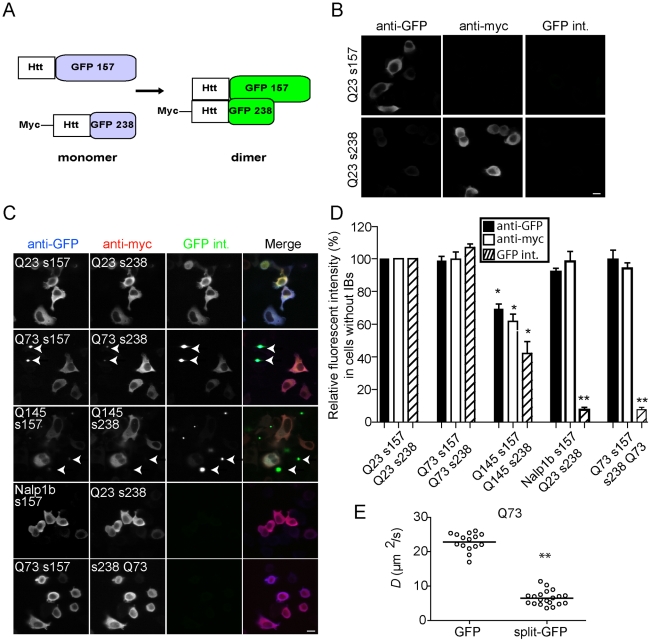
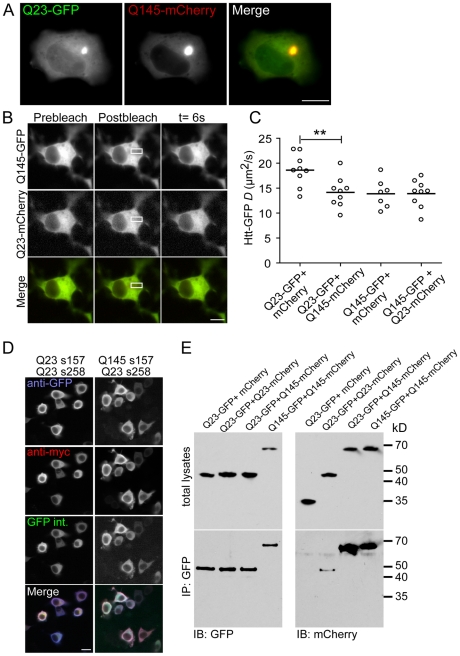
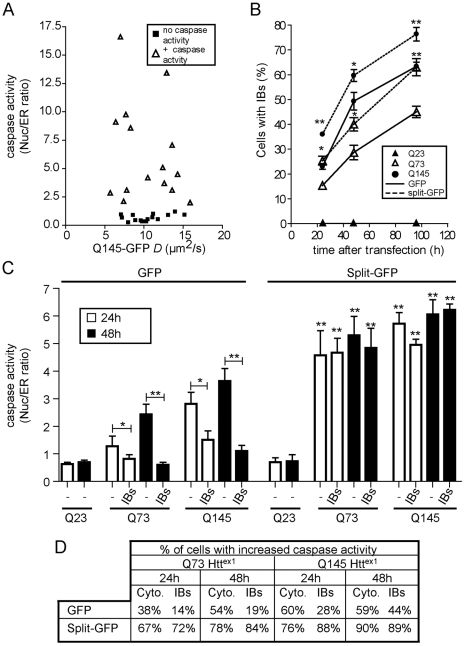
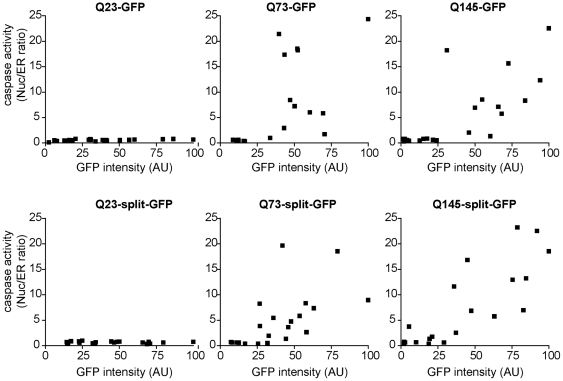
Methodology/principal findings: When fused to a fluorescent reporter (GFP) and expressed in cells, the soluble monomeric and oligomeric polyglutamine species are visually indistinguishable. Here, we describe two complementary biophysical fluorescence microscopy techniques to directly detect soluble polyglutamine oligomers (using Htt exon 1 or Htt(ex1)) and monitor their fates in live cells. Photobleaching analyses revealed a significant reduction in the mobilities of mHtt(ex1) variants consistent with their incorporation into soluble microcomplexes. Similarly, when fused to split-GFP constructs, both wildtype and mHtt(ex1) formed oligomers, as evidenced by the formation of a fluorescent reporter. Only the mHtt(ex1) split-GFP oligomers assembled into IBs. Both FRAP and split-GFP approaches confirmed the ability of mHtt(ex1) to bind and incorporate wildtype Htt into soluble oligomers. We exploited the irreversible binding of split-GFP fragments to forcibly increase levels of soluble oligomeric mHtt(ex1). A corresponding increase in the rate of IBs formation and the number formed was observed. Importantly, higher levels of soluble mHtt(ex1) oligomers significantly correlated with increased mutant cytotoxicity, independent of the presence of IBs.

Conclusions/significance: Our study describes powerful and sensitive tools for investigating soluble oligomeric forms of expanded polyglutamine proteins, and their impact on cell viability. Moreover, these methods should be applicable for the detection of soluble oligomers of a wide variety of aggregation prone proteins.


Conflict of interest statement

Competing Interests: The authors have declared that no competing interests exist.

Figures

Figure 1
Figure 1. Increased number of polyQ repeats correlates with formation of Httex1-GFP inclusion bodies.
(A) Diagram showing the Httex1-GFP constructs containing 23, 73 and 145 polyQ repeats. (B) Western blot showing the relative sizes of the Q23, 73 and 145 Httex1-GFP constructs relative to the empty GFP vector. (C) Representative fluorescent images of N2a cells transfected with Q23, 73 or 145 Httex1-GFP for 16 and 48h. Images were collected with the same settings. (D) Quantitation of the percentage of cells containing IBs for various time points following transfection with Q23, 73 or 145 Httex1-GFP. (E) Quantitation of the Q23, 73 and 145 Httex1-GFP mean fluorescent intensities at indicated times in cells without IBs. Each histogram bar is a mean of values for 30 or more cells. (F) Fluorescent images of N2a cells expressing Httex1-GFP constructs containing 23, 73 or 145 polyQ repeats and immunofluorescently labeled with 3B5H10 antibody. (G) Cytoplasmic GFP intensity for individual cells is quantitated and plotted against the 3B5H10 intensity only in cells not presenting IBs. Images were collected with the same settings Bar = 20 µm.
Figure 2
Figure 2. Mobility of Httex1-GFP constructs.
FLIP analysis of Httex1-GFP mobility in the cytoplasm of N2a cells transfected for 24 h. Repetitive photobleaching of cells within the cytoplasm, in a small ROI (white outline box), was performed. The 0s image represents the first image after the first photobleach. The same ROI was photobleached every 5 seconds. By 150 s, nearly all fluorescence had been depleted from all of the cytoplasm, whereas adjacent cell fluorescence was unaffected. FLIP reveals the presence of small stable IBs (73, arrowhead). When IBs were present, repetitive photobleaching depleted the cytoplasm fluorescence without significantly affecting the IBs fluorescent intensity (bottom row; arrowhead). Bar = 20 µm.
Figure 3
Figure 3. FRAP analysis reveals incorporation of Httex1-GFP mutants into microcomplexes.
(A) Fluorescent images of N2a cells transiently transfected 16 h (to minimize the number of IBs) with Httex1-GFP constructs containing 23, 73 or 145 polyQ repeats arte shown before (prebleach), immediately after (t = 0) and after recover (t = 3.8 s). (B) D values (µm2/s) of single N2a cells transiently transfected with Httex1-GFP constructs containing 23, 73 or 145 polyQ repeats and analyzed by FRAP. (C) Plot of D values (µm2/s) and camera gain settings for N2a cells transiently expressing Q23, Q73 or Q145 Httex1-GFP. (D) D values (µm2/s) of single N2a cells transiently cotransfected with Httex1-GFP constructs containing 23, 73 or 145 polyQ repeats and cytosolic mCherry and analyzed by FRAP. (E) D values (µm2/s) for N2a cells transiently expressing Q23, 73 or 145 Httex1-GFP for 16, 48 and 72 h. Bar = 20 µm.
Figure 4
Figure 4. Visualization of Httex1-GFP oligomers using split-GFP.
(A) Illustration of the fusion of wt and mHttex1 to either 157-GFP or 238-GFP. (B) Cells transfected with Q23 s157 or Q23 s238 separately, stained with anti-GFP or anti-myc, and imaged for GFP fluorescence intensity (GFP int.). (C) Representative images of N2a cells transiently transfected with Httex1Q23 157-GFP+Httex1Q23 238-GFP, Httex1Q73 157-GFP+mHttex1Q73 238-GFP, mHttex1Q145 157-GFP+mHttex1Q145 238-GFP, Nalp1b-157+Httex1Q23 238-GFP or mHttex1Q73 157-GFP+238-GFP mHttex1Q73. (D) Mean fluorescence intensities in cells without IBs are plotted and compared relative to Q23 means, which were set as 100%. (E) D values of single N2a cells transiently transfected with mHttex1Q73-GFP or -split GFP constructs and analyzed by FRAP. Bar = 20 µm. All fluorescence images were collected with the same settings.
Figure 5
Figure 5. Incorporation of wt Httex1-GFP into mutant oligomers.
(A) Representative fluorescent images of N2a cells cotransfected with Httex1Q23-GFP and Q145-mcherry for 48 h. (B) Fluorescent images of N2a cells transiently cotransfected with Httex1Q23-GFP and mHttex1Q145-mCherry constructs are shown before (prebleach), immediately after (t = 0) and after recover (t = 6s). (C) D values for N2a cells co-expressing Httex1Q23-GFP+mCherry, Httex1Q23-GFP+mHttex1Q145-GFP plus cytoplasmic mCherry, and mHttex1Q145-GFP+cytoplasmic mCherry and mHttex1Q145-GFP+Httex1Q23-mCherry. (D) Representative fluorescent images of N2a cells transiently transfected Httex1Q23 s157-GFP+Httex1Q23 s238-GFP, mHttex1Q145 s157-GFP+Httex1Q23 s238-GFP. All images were collected with the same settings for each channel. (E) N2a cells cotransfected with Httex1Q23-GFP+cytoplasmic mCherry, Httex1Q23-GFP+Httex1Q23-mCherry, Httex1Q23-GFP+mHttex1Q145-mCherry or mHttex1Q145-GFP+mHttex1Q145-mCherry. Lysates were incubated with anti-GFP-agarose beads and the lysates and coimmunoprecipitation are shown on immunoblots probed with anti-GFP and anti-mCherry. Bar = 20 µm.
Figure 6
Figure 6. Fusion of mHtt to split-GFP results in increased IBs formation and cell death.
(A) D values (µm2/s) for N2a cells transiently cotransfected with mHttex1Q145-GFP and ER-DEVD-tdTomato. (B) Quantitation of percentage of cells containing IBs for indicated times posttransfection with Httex1Q23, 73 or 145 fused to SFGFP or split-SFGFP constructs. n>215 cells. * p<0.05, ** p<0.005 compared to same length of polyQ fused to GFP. (C) N2a cells were cotransfected with Httex1-GFP or Httex1 split-GFP and ER-DEVD-tdTomato. Both aggregation and cell death were monitored at 24 and 48h posttransfection in cells without (-) or with IBs (inclusion bodies). Each histogram bar reports the mean caspase activity ± standard error. n>38 cells per condition. * p<0.05, ** p<0.005 compared to same parameter (+ or − IBs) for the same Httex1 construct fused to GFP unless specified. (D) Table of percentages of cells with caspase activity with or without IBs.
Figure 7
Figure 7. Levels of soluble cytoplasmic mHttex1 are a negative predictor of cell death.
N2a cells were cotransfected with Q23, 73 or 145 Httex1 fused to GFP or split-GFP and ER-DEVD tdTomato for 48 h. GFP or split-GFP intensities and the nuclear/ER ratio of the apoptosis reporter were quantified for individual cells not presenting IBs. In each plot, the cell with the brightest GFP intensity was defined as having a mean intensity of 100 arbitrary units and other cell intensities were converted to this scale. Thus intensities in one plot are not directly comparable to intensities in another plot. Each square represents a single cell. Increasing mHttex1, but not wt Httex1, levels above some threshold were associated with increased cell death. The existence of apparent thresholds correlating with activation of the caspase activity suggests mHttex1 toxicity is sharply concentration dependent and may depend on titration of one or more key cellular factors.

Similar articles

Cited by

References

    1. Lippincott-Schwartz J, Snapp E, Kenworthy A. Studying protein dynamics in living cells. Nat Rev Mol Cell Biol. 2001;2:444–456. - PubMed
    1. Wouters FS, Bastiaens PI. Imaging protein-protein interactions by fluorescence resonance energy transfer (FRET) microscopy. Curr Protoc Protein Sci Chapter. 2001;19:Unit19 15. - PubMed
    1. Lievens S, Lemmens I, Tavernier J. Mammalian two-hybrids come of age. Trends Biochem Sci. 2009;34:579–588. - PMC - PubMed
    1. Villalobos V, Naik S, Piwnica-Worms D. Detection of protein-protein interactions in live cells and animals with split firefly luciferase protein fragment complementation. Methods Mol Biol. 2008;439:339–352. - PubMed
    1. Gusella JF, MacDonald ME. Huntington's disease: seeing the pathogenic process through a genetic lens. Trends Biochem Sci. 2006;31:533–540. - PubMed

Publication types