

Response of archaeal communities in the rhizosphere of maize and soybean to elevated atmospheric CO2 concentrations
- PMID: 21209969
- PMCID: PMC3012111
- DOI: 10.1371/journal.pone.0015897
Response of archaeal communities in the rhizosphere of maize and soybean to elevated atmospheric CO2 concentrations
Abstract
Background: Archaea are important to the carbon and nitrogen cycles, but it remains uncertain how rising atmospheric carbon dioxide concentrations ([CO(2)]) will influence the structure and function of soil archaeal communities.
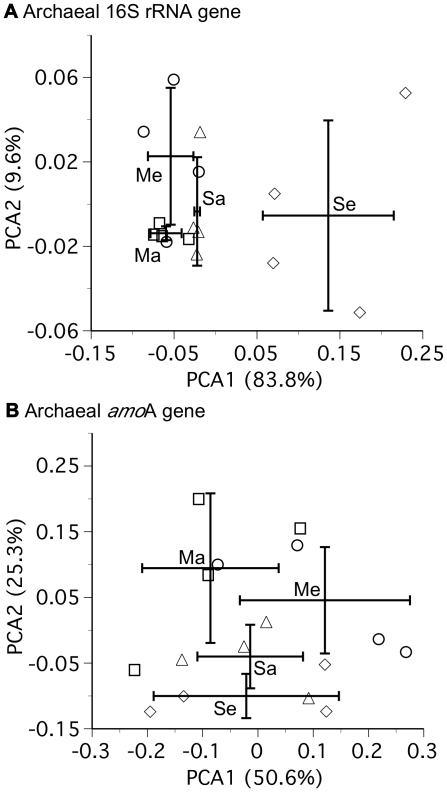
Methodology/principal findings: We measured abundances of archaeal and bacterial 16S rRNA and amoA genes, phylogenies of archaeal 16S rRNA and amoA genes, concentrations of KCl-extractable soil ammonium and nitrite, and potential ammonia oxidation rates in rhizosphere soil samples from maize and soybean exposed to ambient (∼385 ppm) and elevated (550 ppm) [CO(2)] in a replicated and field-based study. There was no influence of elevated [CO(2)] on copy numbers of archaeal or bacterial 16S rRNA or amoA genes, archaeal community composition, KCl-extractable soil ammonium or nitrite, or potential ammonia oxidation rates for samples from maize, a model C(4) plant. Phylogenetic evidence indicated decreased relative abundance of crenarchaeal sequences in the rhizosphere of soybean, a model leguminous-C(3) plant, at elevated [CO(2)], whereas quantitative PCR data indicated no changes in the absolute abundance of archaea. There were no changes in potential ammonia oxidation rates at elevated [CO(2)] for soybean. Ammonia oxidation rates were lower in the rhizosphere of maize than soybean, likely because of lower soil pH and/or abundance of archaea. KCl-extractable ammonium and nitrite concentrations were lower at elevated than ambient [CO(2)] for soybean.
Conclusion: Plant-driven shifts in soil biogeochemical processes in response to elevated [CO(2)] affected archaeal community composition, but not copy numbers of archaeal genes, in the rhizosphere of soybean. The lack of a treatment effect for maize is consistent with the fact that the photosynthesis and productivity of maize are not stimulated by elevated [CO(2)] in the absence of drought.
Conflict of interest statement
Figures


Similar articles
-
The influence of soil pH on the diversity, abundance and transcriptional activity of ammonia oxidizing archaea and bacteria.Environ Microbiol. 2008 Nov;10(11):2966-78. doi: 10.1111/j.1462-2920.2008.01701.x. Epub 2008 Aug 14. Environ Microbiol. 2008. PMID: 18707610
-
Elevated atmospheric CO2 impacts abundance and diversity of nitrogen cycling functional genes in soil.Microb Ecol. 2013 Feb;65(2):394-404. doi: 10.1007/s00248-012-0122-y. Epub 2012 Sep 8. Microb Ecol. 2013. PMID: 22961365
-
Activity, abundance and diversity of nitrifying archaea and bacteria in the central California Current.Environ Microbiol. 2010 Jul;12(7):1989-2006. doi: 10.1111/j.1462-2920.2010.02205.x. Epub 2010 Mar 23. Environ Microbiol. 2010. PMID: 20345944
-
Shifts in microbial communities in soil, rhizosphere and roots of two major crop systems under elevated CO2 and O3.Sci Rep. 2017 Nov 3;7(1):15019. doi: 10.1038/s41598-017-14936-2. Sci Rep. 2017. PMID: 29101364 Free PMC article.
-
Successive phytoextraction alters ammonia oxidation and associated microbial communities in heavy metal contaminated agricultural soils.Sci Total Environ. 2019 May 10;664:616-625. doi: 10.1016/j.scitotenv.2019.01.315. Epub 2019 Jan 25. Sci Total Environ. 2019. PMID: 30763842
Cited by
-
Denaturing gradient gel electrophoresis and barcoded pyrosequencing reveal unprecedented archaeal diversity in mangrove sediment and rhizosphere samples.Appl Environ Microbiol. 2012 Aug;78(16):5520-8. doi: 10.1128/AEM.00386-12. Epub 2012 Jun 1. Appl Environ Microbiol. 2012. PMID: 22660713 Free PMC article.
-
Soil Conditions Rather Than Long-Term Exposure to Elevated CO2 Affect Soil Microbial Communities Associated with N-Cycling.Front Microbiol. 2017 Oct 18;8:1976. doi: 10.3389/fmicb.2017.01976. eCollection 2017. Front Microbiol. 2017. PMID: 29093701 Free PMC article.
-
Effect of elevated CO2, O3, and UV radiation on soils.ScientificWorldJournal. 2014 Feb 6;2014:730149. doi: 10.1155/2014/730149. eCollection 2014. ScientificWorldJournal. 2014. PMID: 24688424 Free PMC article. Review.
-
The large-scale distribution of ammonia oxidizers in paddy soils is driven by soil pH, geographic distance, and climatic factors.Front Microbiol. 2015 Sep 4;6:938. doi: 10.3389/fmicb.2015.00938. eCollection 2015. Front Microbiol. 2015. PMID: 26388866 Free PMC article.
-
Ectomycorrhizal Fungi Dominated the Root and Rhizosphere Microbial Communities of Two Willow Cultivars Grown for Six-Years in a Mixed-Contaminated Environment.J Fungi (Basel). 2022 Jan 30;8(2):145. doi: 10.3390/jof8020145. J Fungi (Basel). 2022. PMID: 35205899 Free PMC article.
References
-
- Drigo B, Kowalchuk GA, van Veen JA. Climate change goes underground: effects of elevated atmospheric CO2 on microbial community structure and activities in the rhizosphere. Biology and Fertility of Soils. 2008;44:667–679.
-
- Jossi M, Fromin N, Tarnawski S, Kohler F, Gillet F, et al. How elevated pCO2 modifies total and metabolically active bacterial communities in the rhizosphere of two perennial grasses grown under field conditions. Fems Microbiology Ecology. 2006;55:339–350. - PubMed
-
- Janus LR, Angeloni NL, McCormack J, Rier ST, Tuchman NC, et al. Elevated atmospheric CO2 alters soil microbial communities associated with trembling aspen (Populus tremuloides) roots. Microbial Ecology. 2005;50:102–109. - PubMed
-
- Drigo B, Van Veen JA, Kowalchuk GA. Specific rhizosphere bacterial and fungal groups respond differently to elevated atmospheric CO2. ISME Journal. 2009;3:1204–1217. - PubMed
-
- Austin EE, Castro HF, Sides KE, Schadt CW, Classen AT. Assessment of 10 years of CO2 fumigation on soil microbial communities and function in a sweetgum plantation. Soil Biology & Biochemistry. 2009;41:514–520.
Publication types
MeSH terms
Substances
LinkOut - more resources
Full Text Sources
Miscellaneous
