

Numerical assessment of time-domain methods for the estimation of local arterial pulse wave speed
- PMID: 21211799
- PMCID: PMC3111821
- DOI: 10.1016/j.jbiomech.2010.12.002
Numerical assessment of time-domain methods for the estimation of local arterial pulse wave speed
Abstract
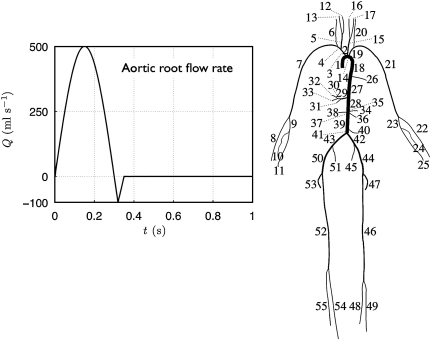
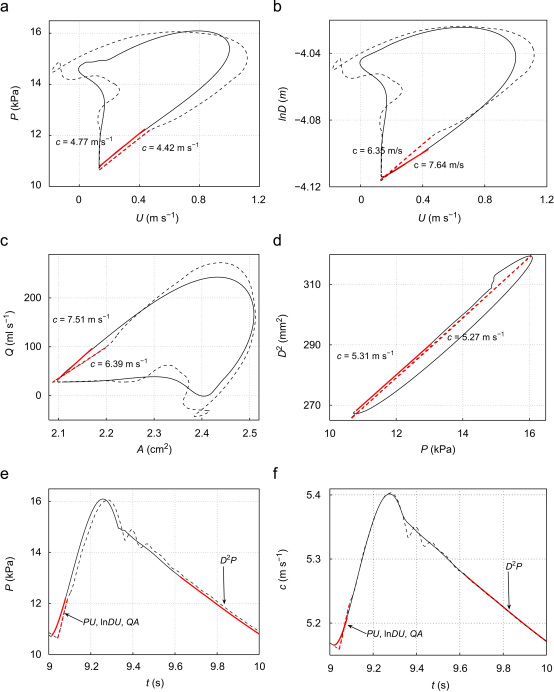
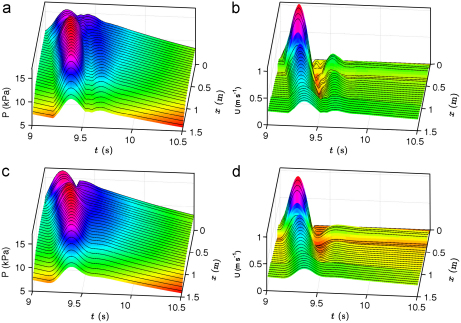
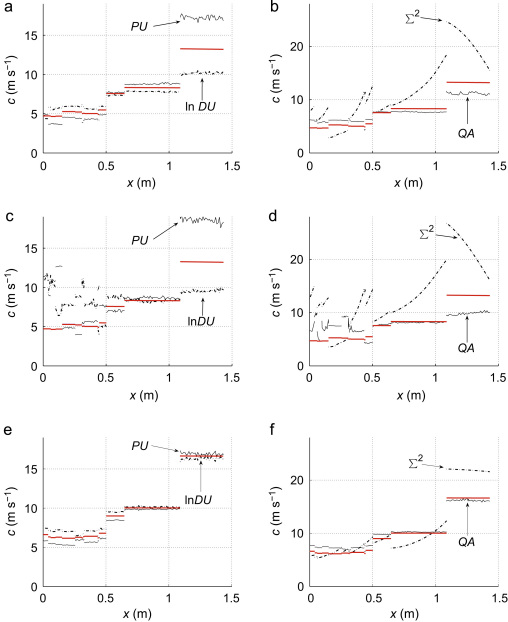
A local estimation of pulse wave speed c, an important predictor of cardiovascular events, can be obtained at arterial locations where simultaneous measurements of blood pressure (P) and velocity (U), arterial diameter (D) and U, flow rate (Q) and cross-sectional area (A), or P and D are available, using the PU-loop, sum-of-squares (∑(2)), lnDU-loop, QA-loop or new D(2)P-loop methods. Here, these methods were applied to estimate c from numerically generated P, U, D, Q and A waveforms using a visco-elastic one-dimensional model of the 55 larger human systemic arteries in normal conditions. Theoretical c were calculated from the parameters of the model. Estimates of c given by the loop methods were closer to theoretical values and more uniform within each arterial segment than those obtained using the ∑(2). The smaller differences between estimates and theoretical values were obtained using the D(2)P-loop method, with root-mean-square errors (RMSE) smaller than 0.18 ms(-1), followed by averaging the two c given by the PU- and lnDU-loops (RMSE <2.99 ms(-1)). In general, the errors of the PU-, lnDU- and QA-loops decreased at locations where visco-elastic effects were small and nearby junctions were well-matched for forward-travelling waves. The ∑(2) performed better at proximal locations.
Copyright © 2010 Elsevier Ltd. All rights reserved.
Figures
References
-
- Aguado-Sierra, J., Parker, K., Davies, J., Francis, D., Hughes, A., Mayet, J., 2006. Arterial pulse wave velocity in coronary arteries. In: 28th Annual International Conference of the IEEE Engineering in Medicine and Biology Society, New York City, USA. Paper ThB09.2. - PubMed
-
- Alastruey J., Parker K., Peiró J., Sherwin S. Lumped parameter outflow models for 1-D blood flow simulations: effect on pulse waves and parameter estimation. Commun. Comput. Phys. 2008;4:317–336.
-
- Alastruey J., Parker K., Peiró J., Sherwin S. Analysing the pattern of pulse waves in arterial networks: a time-domain study. J. Eng. Math. 2009;64:331–351.
-
- Alastruey, J., On the mechanics underlying the reservoir—excess separation in systemic arteries and their implications for pulse wave analysis. Cardiov. Eng., in press, doi:10.1007/s10558-010-9109-9. - DOI - PMC - PubMed
-
- Armentano R., Megnien J., Simon A., Bellenfant F., Barra J., Levenson J. Effects of hypertension on viscoelasticity of carotid and femoral arteries in humans. Hypertension. 1995;26:48–54. - PubMed
Publication types
MeSH terms
Grants and funding
LinkOut - more resources
Full Text Sources
Other Literature Sources
