. 2011 Jan;84(1):30-7.
doi: 10.4269/ajtmh.2011.10-0472.

Addressing institutional amplifiers in the dynamics and control of tuberculosis epidemics

Affiliations

Addressing institutional amplifiers in the dynamics and control of tuberculosis epidemics

Sanjay Basu et al. Am J Trop Med Hyg. 2011 Jan.

Abstract

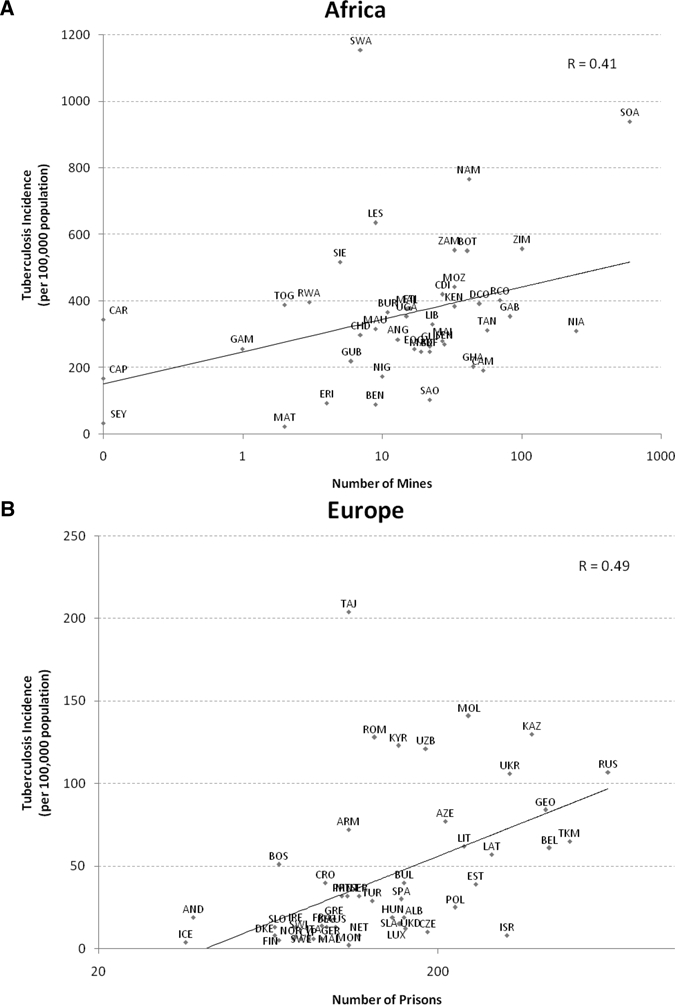
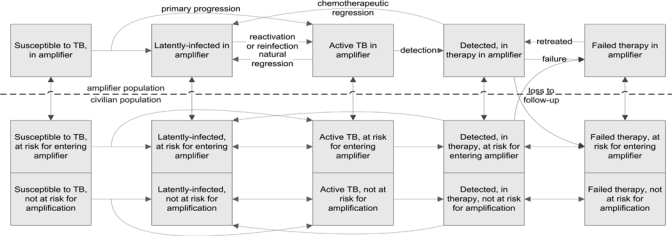
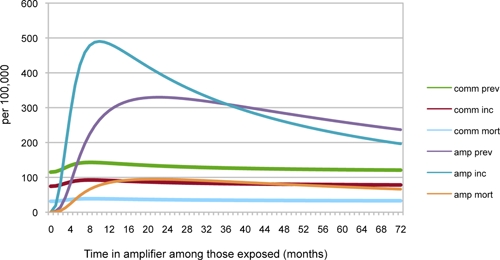
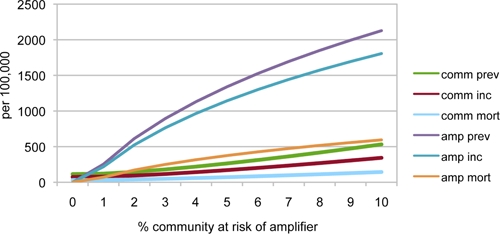
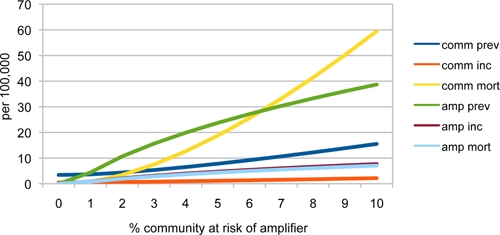
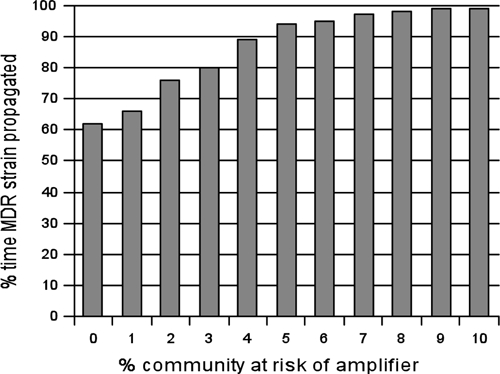
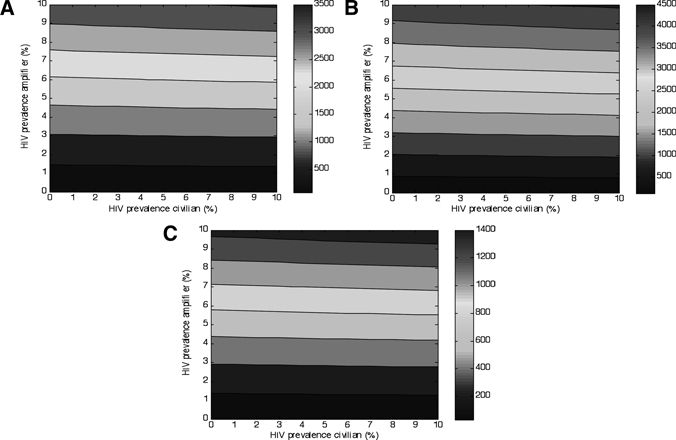
Tuberculosis outbreaks originating in prisons, mines, or hospital wards can spread to the larger community. Recent proposals have targeted these high-transmission institutional amplifiers by improving case detection, treatment, or reducing the size of the exposed population. However, what effects these alternative proposals may have is unclear. We mathematically modeled these control strategies and found case detection and treatment methods insufficient in addressing epidemics involving common types of institutional amplifiers. Movement of persons in and out of amplifiers fundamentally altered the transmission dynamics of tuberculosis in a manner not effectively mitigated by detection or treatment alone. Policies increasing the population size exposed to amplifiers or the per-person duration of exposure within amplifiers potentially worsened incidence, even in settings with high rates of detection and treatment success. However, reducing the total population size entering institutional amplifiers significantly lowered tuberculosis incidence and the risk of propagating new drug-resistant tuberculosis strains.


Figures

Figure 1.
Figure 1.
Associations between tuberculosis incidence and the number of mines (A) and prisons (B) in a country. Country name abbreviations are the standard three-letter abbreviations set by the United Nations, and the nations included in the African (A) and European (B) regions are from the World Health Organization regional designation.
Figure 2.
Figure 2.
Flow diagram of amplifier model. Green arrows show migration to and from the amplifier, and gray arrows show rates of loss to follow-up from treatment during migration, where the probability of loss is varied in the model simulations. Drug resistance, human immunodeficiency virus (HIV), and mortality are included in the model (see Supplemental Appendix) but are not displayed in the diagram for simplicity. Mortality and HIV can affect persons in all compartments, and drug resistance can affect a portion of patients who are not successfully treated.
Figure 3.
Figure 3.
Tuberculosis rates/100,000 population. The length of exposure within the amplifier was varied. The simulation parameters are 1% of the community at risk for amplification, and World Health Organization standard model rates of 50% case detection and 70% treatment success. In southern African mines, the length of exposure is typically 9 months; in Russian prisons, the length of exposure is typically 62 months (5.2 years); see Supplemental Appendix, Table 1 for references. This figure appears in color at www.ajtmh.org.
Figure 4.
Figure 4.
Steady state tuberculosis incidence, prevalence, and mortality/100,000 in overall community and in the amplifier when various portions of the general population are at risk for entering an amplifier. We use the prison parameter of 5.2 years average incarceration time, and World Health Organization parameters of 50% case detection and 70% treatment success. The amplifier community rates are in terms of 100,000 persons in the amplifier. This figure appears in color at www.ajtmh.org.
Figure 5.
Figure 5.
Effect of amplifier exposure on multidrug-resistant tuberculosis (MDR TB) rates and MDR TB mortality. This figure appears in color at www.ajtmh.org.
Figure 6.
Figure 6.
Proportion of time that a new multidrug-resistant tuberculosis strain successfully propagated in the community, when running the model stochastically and sampling from the uncertainty distributions of parameter values.
Figure 7.
Figure 7.
Effects of human immunodeficiency virus prevalence in amplifier and civilian community on tuberculosis (TB) incidence (A), prevalence (B), and mortality (C). The World Health Organization model 50% case detection rate and 70% treatment success rate, with 1% of the population at risk for amplification, and 9 months of exposure as with South African mines was used. The right-sided color bar indicates the TB rate/100,000 population.

References

    1. World Health Organization . Global Tuberculosis Control: Epidemiology, Strategy, Financing. Geneva: World Health Organization. WHO/HTM/TB/2009.411; 2009.
    1. Dorman SE, Chaisson RE. From magic bullets back to the Magic Mountain: the rise of extensively drug-resistant tuberculosis. Nat Med. 2007;13:295–298. - PubMed
    1. Gandhi NR, Moll A, Sturm AW, Pawinski R, Govender T, Lalloo U, Zeller K, Andrews J, Friedland G. Extensively drug-resistant tuberculosis as a cause of death in patients co-infected with tuberculosis and HIV in a rural area of South Africa. Lancet. 2006;368:1575–1580. - PubMed
    1. Basu S, Friedland GH, Medlock J, Andrews JR, Shah NS, Gandhi NR, Moll A, Moodley P, Sturm AW, Galvani AP. Averting epidemics of extensively drug-resistant tuberculosis. Proc Natl Acad Sci U S A. 2009;106:7672–7677. - PMC - PubMed
    1. World Health Organization . Global Tuberculosis Control: Surveillance, Planning, Financing. Geneva: World Health Organization. WHO/HTM/TB2008.393; 2008.

Publication types