. 2011 Mar 18;286(11):9503-13.
doi: 10.1074/jbc.M110.165613. Epub 2011 Jan 6.

Absence of Tec family kinases interleukin-2 inducible T cell kinase (Itk) and Bruton's tyrosine kinase (Btk) severely impairs Fc epsilonRI-dependent mast cell responses

Affiliations

Absence of Tec family kinases interleukin-2 inducible T cell kinase (Itk) and Bruton's tyrosine kinase (Btk) severely impairs Fc epsilonRI-dependent mast cell responses

Archana S Iyer et al. J Biol Chem. .

Abstract

Mast cells are critical effector cells in the pathophysiology of allergic asthma and other IgE-mediated diseases. The Tec family of tyrosine kinases Itk and Btk serve as critical signal amplifiers downstream of antigen receptors. Although both kinases are expressed and activated in mast cells following FcεRI stimulation, their individual contributions are not clear. To determine whether these kinases play unique and/or complementary roles in FcεRI signaling and mast cell function, we generated Itk and Btk double knock-out mice. Analyses of these mice show decreased mast cell granularity and impaired passive systemic anaphylaxis responses. This impaired response is accompanied by a significant elevation in serum IgE in Itk/Btk double knock-out mice. In vitro analyses of bone marrow-derived mast cells (BMMCs) indicated that Itk/Btk double knock-out BMMCs are defective in degranulation and cytokine secretion responses downstream to FcεRI activation. These responses were accompanied by a significant reduction in PLCγ2 phosphorylation and severely impaired calcium responses in these cells. This defect also results in altered NFAT1 nuclear localization in double knock-out BMMCs. Network analysis suggests that although they may share substrates, Itk plays both positive and negative roles, while Btk primarily plays a positive role in mast cell FcεRI-induced cytokine secretion.


Figures

FIGURE 1.
FIGURE 1.
Itk/Btk DKO skin mast cells have severely decreased granule density in vivo. A, skin sections from WT, Itk−/−, Btk−/−, and Itk/Btk DKO stained with Toluidine blue. Blue identifies filled granules, and the pink identifies empty granules. 10× magnification and expanded inset is ×60 magnification. B, transmission electron microscope images of skin mast cells from WT, Itk−/−, Btk−/−, and Itk/Btk DKO mice.
FIGURE 2.
FIGURE 2.
Decreased histamine secretion in response to systemic anaphylaxis in Itk/Btk DKO mice. A, WT, Itk−/−, Btk−/−, and Itk/Btk DKO mice were injected with anti-DNP IgE, and 24 h later, were challenged intravenously with DNP-HSA. Animals were sacrificed 3 min later and sera collected and assayed for histamine content (n = 3, *, p value < 0.05, statistically significant difference between WT and all other strains). B, serum IgE levels in WT, Itk−/−, Btk−/−, and Itk/Btk DKO mice (n = 3, *, p value < 0.05, statistically significant difference between WT and all other strains). C, plot of serum IgE levels and histamine response to systemic anaphylaxis in WT, Itk−/−, Btk−/−, and Itk/Btk DKO mice. D, mean fluorescence intensity of surface IgE levels on directly isolated peritoneal mast cells from WT, Itk−/−, Btk−/−, and Itk/Btk DKO mice (n = 3, *, p value < 0.05, statistically significant difference between WT and all other strains). E, percentage of IgE class switched B cells in the spleens of WT, Itk−/−, Btk−/−, and Itk/Btk DKO mice (n = 3, *, p value < 0.05, statistically significant difference between WT and all other strains).
FIGURE 3.
FIGURE 3.
Normal development but enhanced growth of Itk/Btk DKO bone marrow-derived mast cells. A, FcϵRI and c-Kit expression on in vitro generated BMMCs from WT, Itk−/−, Btk−/−, and Itk/Btk DKO mice after 4 weeks in culture. B, transmission electron microscope images of bone marrow-derived mast cells from WT, Itk−/−, Btk−/−, and Itk/Btk DKO mice. C, left, analysis of number of cells in IL-3 cultures of bone marrow from WT, Itk−/−, Btk−/−, and Itk/Btk DKO mice over the indicated weeks (n = 3, *, p value < 0.05, statistically significant difference between Itk/Btk DKO, Btk−/−, and WT cells). Right, analysis of number of cells recovered after addition of IL-3 to IL-3-starved overnight cultures of differentiated BMMCs from WT, Itk−/−, Btk−/−, and Itk/Btk DKO mice over the indicated number of days.
FIGURE 4.
FIGURE 4.
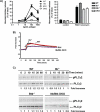
Itk/Btk DKO BMMCs have impaired degranulation and decreased calcium responses to FcϵRI signaling. A, BMMCs from WT, Itk−/−, Btk−/−, and Itk/Btk DKO were coated overnight with anti-IgE-DNP in the absence of IL-3, then stimulated with the indicated concentrations of antigen (DNP-HSA) for 45 min. Degranulation is expressed as percent release of total cellular hexosaminidase (n = 3, p < 0.05 (by ANOVA) between WT and Itk/Btk DKO, between WT and Itk−/−, as well as between Itk−/− and Btk−/−, and Itk−/− and Itk/Btk DKO BMMCs) (left panel). BMMCs were stimulated with PMA/Ionomycin and analyzed for hexosaminidase release expressed as a percentage of total hexosaminidase released (right panel). B, BMMCs from WT, Itk−/−, Btk−/−, and Itk/Btk DKO were coated overnight with anti-IgE-DNP in the absence of IL-3, loaded with FURA-2, then stimulated with 100 ng/ml DNP-HSA for the indicated times and fluorescence changes analyzed. Data are expressed as fold increase over baseline. Black line, WT, red line, Itk−/−, green line, Btk−/−, and purple line, Itk/Btk DKO BMMCs. C, BMMCs from WT, Itk−/−, Btk−/−, and Itk/Btk DKO were coated overnight with anti-IgE-DNP in the absence of IL-3, then stimulated with anti-IgE for the indicated times. Total cell lysates were prepared, separated by SDS-PAGE, transferred to PVDF and probed with anti-phospho-PLCγ2 (pY1217, top panels) or anti-PLCγ2 (bottom panels). Signals were detected by enhanced chemiluminescence, and all panels came from the same exposure.
FIGURE 5.
FIGURE 5.
Decreased activation of p38 and increased activation of ERK MAPKs in Itk/Btk DKO BMMCs. WT and Itk−/− BMMCs (top panel), or Btk−/−, and Itk/Btk DKO BMMCs (bottom panel) were loaded with anti-DNP IgE overnight in the absence of IL-3, then stimulated with anti-IgE (A, B) or DNP-HSA (C) for the indicated time periods. Cells were lysed, and total cell lysates separated by SDS-PAGE, transferred to PVDF membranes and probed with (A) anti-phospho-p38 or (B, C) anti-phospho-ERK. Top panels depict phosphorylated MAPKs, and bottom panels depict total p38 (A) or total ERK (B).
FIGURE 6.
FIGURE 6.
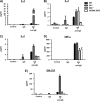
Differential regulation of FcϵR induced cytokine secretion by Itk and Btk in BMMCs. WT, Itk−/−, Btk−/−, and Itk/Btk DKO BMMCs were loaded with anti-DNP IgE overnight in the absence IL-3, then stimulated with anti-IgE for 24 h. Supernatants were collected and assayed for A, IL-2 (*, p < 0.05 (WT versus Itk−/−); p < 0.05 (WT versus Btk−/−); p < 0.05 (WT versus Itk/Btk DKO); B, IL-3 (*, p < 0.05 (WT versus Itk/Btk DKO); C, IL-4 (*, p < 0.05 (WT versus Btk−/−); p < 0.05 (WT versus Itk/Btk DKO); D, TNF-α; and E, GM-CSF (*, p < 0.05 (WT versus Itk−/−); p < 0.05 (WT versus Itk/Btk DKO). Other differences were not statistically different from the WT BMMCs.
FIGURE 7.
FIGURE 7.
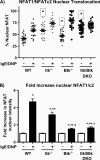
Nuclear localization of NFAT1/NFATc2 is differentially regulated by Itk and Btk in BMMCs. BMMCs generated from WT, Itk−/−, Btk−/−, and Itk/Btk DKO mice were starved of IL-3 overnight then left unstimulated (control) or stimulated with anti-DNP-IgE along with DNP-HSA. Cells were fixed and stained with antibodies against NFAT1/NFATc2, and ∼25 cells from each strain analyzed for % of cells that had nuclear NFAT staining (A), *, p < 0.05 versus WT. B, cells analyzed in A were further analyzed for NFAT nuclear fluorescent intensity, and fluorescence in non-stimulated cells set at 1. The fluorescence in stimulated cells was then compared for fold increase NFAT nuclear staining after stimulation. *, p < 0.05 versus Control; **, p < 0.05 versus WT; †, p < 0.05 versus Itk-null.
FIGURE 8.
FIGURE 8.
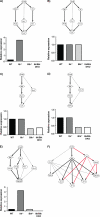
Boolean network modeling of the role of Itk and Btk in FcϵR induced cytokine secretion in BMMCs. Boolean analysis of the contribution of Itk and Btk in response to FcϵR stimulations in BMMCs in vitro for A, IL-2; B, IL-3; C, IL-4; D, TNF-α; E, GM-CSF secretion; or F, all cytokines analyzed. Pathways depict rules that lead to the observed behavior of the indicated response and the role of Itk and Btk in this process. Graphs show the results of simulation of the networks indicated for 45 steps. Pa B: pathway regulated by Btk; Pa F: Itk and Btk independent pathway regulated by the FcϵR; Pa I: pathway regulated by Itk; Pa I2: pathway 2 regulated by Itk. Note that all are assumed to be indirect pathways. The thickness of the lines depict the importance of the pathway and (→) indicates activation, while the red lines indicates inhibition. See text and supplemental information for further details.

References

    1. Kawakami Y., Yao L., Miura T., Tsukada S., Witte O. N., Kawakami T. (1994) Mol. Cell Biol. 14, 5108–5113 - PMC - PubMed
    1. Kawakami Y., Yao L., Tashiro M., Gibson S., Mills G. B., Kawakami T. (1995) J. Immunol. 155, 3556–3562 - PubMed
    1. Schmidt U., Abramova A., Boucheron N., Eckelhart E., Schebesta A., Bilic I., Kneidinger M., Unger B., Hammer M., Sibilia M., Valent P., Ellmeier W. (2009) Eur. J. Immunol. 39, 3228–3238 - PubMed
    1. Forssell J., Sideras P., Eriksson C., Malm-Erjefält M., Rydell-Törmänen K., Ericsson P., Erjefält J. (2005) Am. J. Respir. Cell Mol. Biol. 32, 511–520 - PubMed
    1. Iyer A. S., August A. (2008) J. Immunol. 180, 7869–7877 - PMC - PubMed

Publication types

MeSH terms

LinkOut - more resources