. 2011 Jan 7;331(6013):83-7.
doi: 10.1126/science.1195870.

Spontaneous cortical activity reveals hallmarks of an optimal internal model of the environment

Affiliations

Spontaneous cortical activity reveals hallmarks of an optimal internal model of the environment

Pietro Berkes et al. Science. .

Abstract

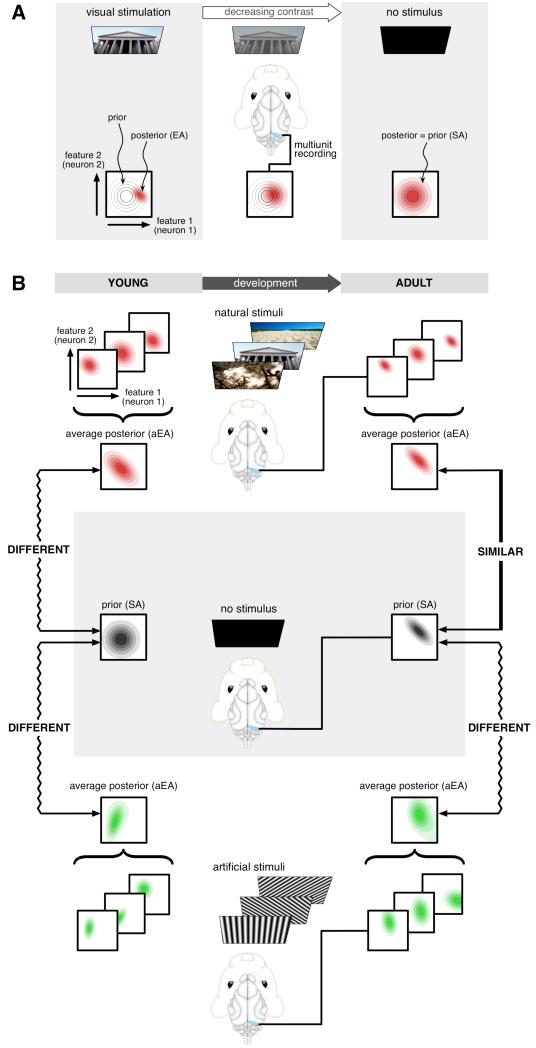
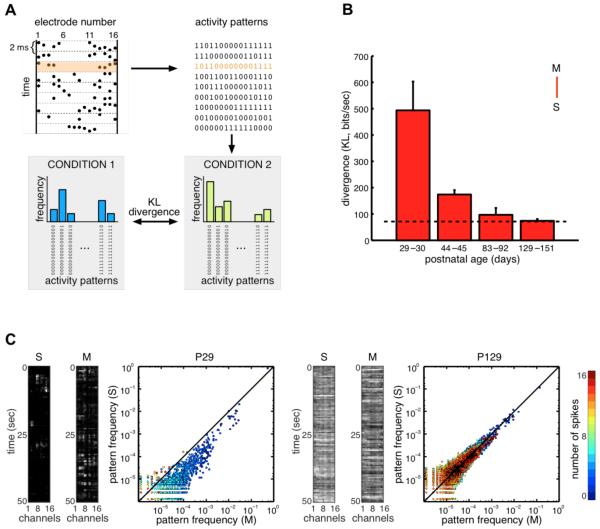
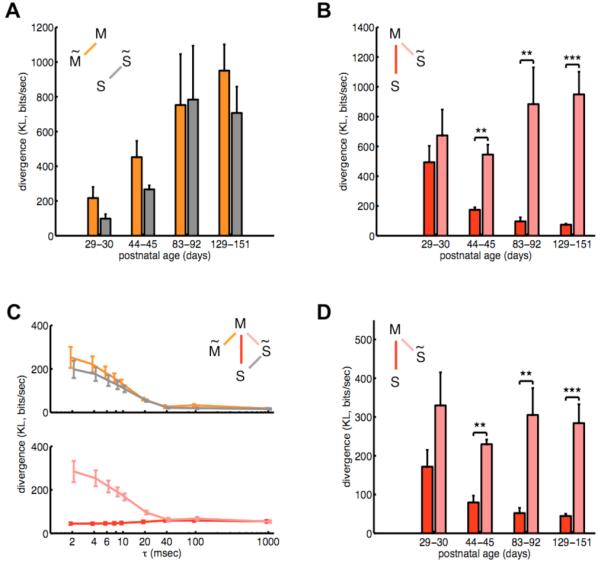
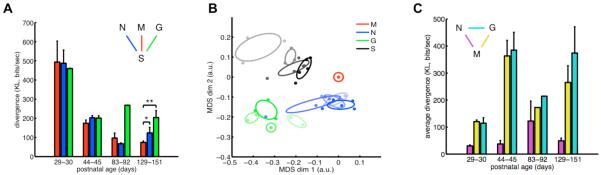
The brain maintains internal models of its environment to interpret sensory inputs and to prepare actions. Although behavioral studies have demonstrated that these internal models are optimally adapted to the statistics of the environment, the neural underpinning of this adaptation is unknown. Using a Bayesian model of sensory cortical processing, we related stimulus-evoked and spontaneous neural activities to inferences and prior expectations in an internal model and predicted that they should match if the model is statistically optimal. To test this prediction, we analyzed visual cortical activity of awake ferrets during development. Similarity between spontaneous and evoked activities increased with age and was specific to responses evoked by natural scenes. This demonstrates the progressive adaptation of internal models to the statistics of natural stimuli at the neural level.


Figures

Fig. 1
Fig. 1. Assessing the statistical optimality of the internal model in the visual cortex
(A) The posterior distribution represented by EA (bottom, red filled contours show pairwise activity distributions) in response to a visual stimulus (top) is increasingly dominated by the prior distribution (bottom, gray contours) as brightness or contrast is decreased from maximum (left) to lower levels (middle). In the absence of stimulation (right), the posterior converges to the prior and thus SA recorded in darkness represents this prior. (B) Multiunit activity recorded in V1 (middle column) of awake, freely viewing ferrets either receiving no stimulus (middle) or viewing natural (top) or artificial stimuli (bottom) is used to construct neural activity distributions in young and adult animals. Under natural and artificial stimuli conditions, EA distributions represent distributions of visual features (red and green panels) inferred from particular stimuli. Average EA distributions (aEA) evoked by different stimuli ensembles are compared to the distribution of SA recorded in darkness (black panels), representing the prior expectations about visual features. Quantifying the dissimilarity between the SA distribution and the aEA distribution reveals the level of statistical adaptation of the internal model to the stimulus ensemble. The internal model of young animals (left) is expected to show little adaptation to the natural environment and thus aEA for natural (and also for artificial) scenes should be different from SA. Adult animals (right) are expected to be adapted to natural scenes and thus to exhibit a high degree of similarity between SA and natural stimuli-aEA, but not between SA and artificial stimuli-aEA.
Fig. 2
Fig. 2. Improving match between aEA and SA over development
(A) Spikes were recorded on 16 electrodes, discretized in 2 ms bins, and converted to binary strings, so that each string described the activity pattern of cells at a given time point (top). For each condition, the histogram of activity patterns was constructed, and different histograms were compared by measuring their divergence (bottom). (B) Divergence between the distributions of activity patterns in movie-aEA (M) and SA (S), as a function of age (red bars). As a reference, the dashed line shows the average of the within-condition baselines computed with whithin-condition data split in two halves (Fig. S1). (C) Frequency of occurrence of activity patterns under SA (S, y-axis) vs. movie-aEA (M, x-axis) in a young (left) and adult (right) animal. Each dot represents one of the 216 = 65536 possible binary activity patterns, color code indicates number of spikes. Black line shows equality. The panels at the left of the plots show examples of neural activity on the 16 electrodes in representative SA and movie-aEA trials for the same animals. Error bars on all figures represent SEM.
Fig. 3
Fig. 3. Contribution of spatial and temporal correlations to the match between aEA and SA
(A,B) The role of spatial correlations was quantified by the divergence between the measured distributions of neural activity patterns, movie-aEA (M) and SA (S), and the surrogate versions of the same distributions (M̃ and S̃), in which correlations between channels were removed, while keeping the firing rates intact (17). (A) The divergence between the measured and surrogate distributions increased significantly over age for both movie-aEA (orange) and SA (gray). (B) Enhanced match between movie-aEA and SA over development (red, cf. Fig. 2B) disappeared when spatial correlations were removed from SA (pink). (C,D) Divergence of transition probability distributions between measured neural activity patterns and their surrogate versions, in which temporal correlations were removed, while keeping firing rates and spatial correlations intact (17). (C) Temporal correlations in adult animals (P129-151) as a function of the time interval, τ. Within-condition divergences (top) show that temporal correlations decreased with time lag both in movie-aEA (orange) and in SA (gray). Across-condition comparison (bottom) of the divergence of aEA from the measured SA (red) and from the surrogate SA (pink) shows that temporal correlations in the two conditions were matched up to time intervals when they decayed to zero. (D) Temporal correlations at the shortest time interval (τ = 2 ms) as a function of age. The match of transition probabilities between movie-aEA and SA improved (red). Removing temporal correlations from SA eliminated this match (pink). In all figures, *p<0.05, **p<0.01, ***p<0.001, m-test.
Fig. 4
Fig. 4. Similarity between aEA and SA is specific to natural scenes
(A) Divergence between neural activity patterns evoked by different stimulus ensembles (movie-aEA: red, M; noise-aEA: blue, N; gratings-aEA: green, G) and those observed in SA. In adult animals, SA was significantly more similar to movie-aEA than noise-aEA or gratings-aEA. (B) Two-dimensional projection of all neural activity distributions. Each dot represents one activity distribution in a different animal, colors indicate stimulus ensembles (movie-aEA: red, M; noise-aEA: blue, N; gratings-aEA: green, G; SA: black, S), intensity indicates age group (in the order of increasing intensity: P29-30, P44-45, P83-92, P129-151), ellipses delineate distributions belonging to the same age group. Positions of dots were computed by multi-dimensional scaling (MDS) to be maximally consistent with pairwise divergences between distributions. Movie-aEAs were defined to be at the origin. For young animals (faintest colors), SA was significantly dissimilar from all aEA distributions. Over development, SA moved closer to all aEAs; but by P129-151, SA was significantly more similar to movie-aEA than artificial stimuli-aEAs, as quantified in (A). (C) Divergences measured directly between different aEA distributions (noise-aEA and movie-aEA: magenta, gratings-aEA and movie-aEA: yellow, gratings-aEA and noise-aEA: cyan) showed no decrease in the specificity of the responses to different stimulus ensembles.

References

    1. Kersten D, Mamassian P, Yuille A. Object perception as Bayesian inference. Annu. Rev. Psychol. 2004;55:271–304. - PubMed
    1. Fiser J, Berkes P, Orbán G, Lengyel M. Statistically optimal perception and learning: from behavior to neural representations. Trends Cogn. Sci. 2010;14:119–130. - PMC - PubMed
    1. Weiss Y, Simoncelli EP, Adelson EH. Motion illusions as optimal percepts. Nat. Neurosci. 2002;5:598–604. - PubMed
    1. Wolpert DM, Ghahramani Z, Jordan MI. An internal model for sensorimotor integration. Science. 1995;269:1880–1882. - PubMed
    1. Courville AC, Daw ND, Touretzky DS. Bayesian theories of conditioning in a changing world. Trends Cogn. Sci. 2006;10:294–300. - PubMed

Publication types