

Estimation of hepatic proton-density fat fraction by using MR imaging at 3.0 T
- PMID: 21212366
- PMCID: PMC3042639
- DOI: 10.1148/radiol.10100659
Estimation of hepatic proton-density fat fraction by using MR imaging at 3.0 T
Abstract
Purpose: To compare the accuracy of several magnetic resonance (MR) imaging-based methods for hepatic proton-density fat fraction (FF) estimation at 3.0 T, with spectroscopy as the reference technique.
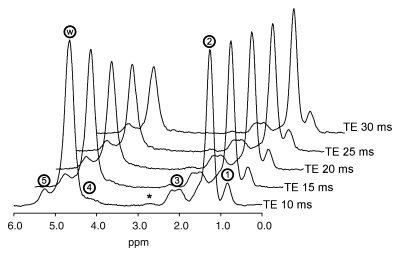
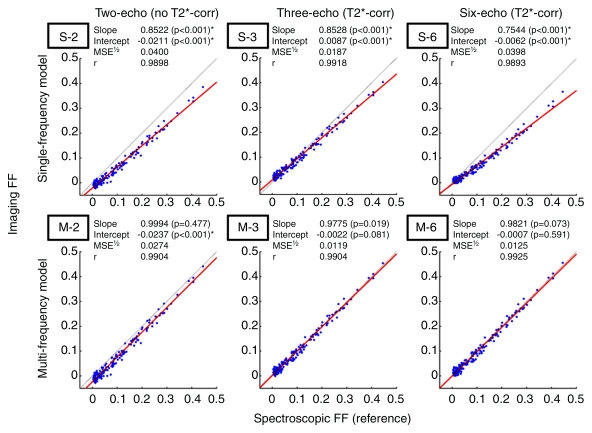
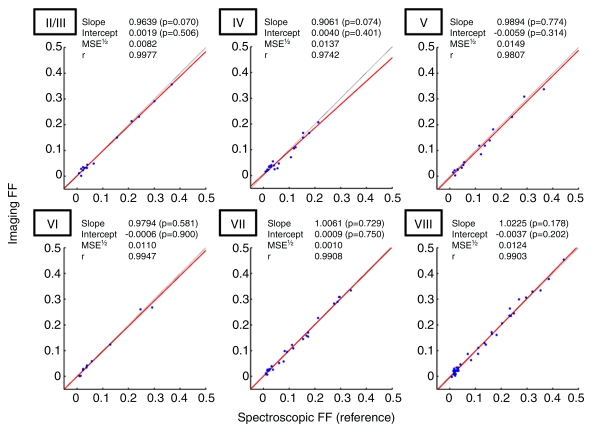
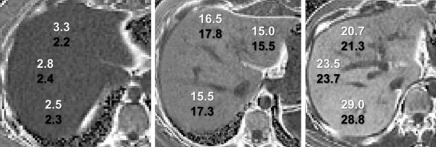
Materials and methods: This prospective study was institutional review board approved and HIPAA compliant. Informed consent was obtained. One hundred sixty-three subjects (39 with known hepatic steatosis, 110 with steatosis risk factors, 14 without risk factors) underwent proton MR spectroscopy and non-T1-weighted gradient-echo MR imaging of the liver. At spectroscopy, the reference FF was determined from frequency-selective measurements of fat and water proton densities. At imaging, FF was calculated by using two-, three-, or six-echo methods, with single-frequency and multifrequency fat signal modeling. The three- and six-echo methods corrected for T2*; the two-echo methods did not. For each imaging method, the fat estimation accuracy was assessed by using linear regression between the imaging FF and spectroscopic FF. Binary classification accuracy of imaging was assessed at four reference spectroscopic thresholds (0.04, 0.06, 0.08, and 0.10 FF).
Results: Regression intercept of two-, three-, and six-echo methods were -0.0211, 0.0087, and -0.0062 (P <.001 for all three) without multifrequency modeling and -0.0237 (P <.001), 0.0022, and -0.0007 with multifrequency modeling, respectively. Regression slope of two-, three-, and six-echo methods were 0.8522, 0.8528, and 0.7544 (P <.001 for all three) without multifrequency modeling and 0.9994, 0.9775, and 0.9821 with multifrequency modeling, respectively. Significant deviation of intercept and slope from 0 and 1, respectively, indicated systematic error. Classification accuracy was 82.2%-90.1%, 93.9%-96.3%, and 83.4%-89.6% for two-, three-, and six-echo methods without multifrequency modeling and 88.3%-92.0%, 95.1%-96.3%, and 94.5%-96.3% with multifrequency modeling, respectively, depending on the FF threshold. T2*-corrected (three- and six-echo) multifrequency imaging methods had the overall highest FF estimation and classification accuracy. Among methods without multifrequency modeling, the T2-corrected three-echo method had the highest accuracy.
Conclusion: Non-T1-weighted MR imaging with T2 correction and multifrequency modeling helps accurately estimate hepatic proton-density FF at 3.0 T.
© RSNA, 2011.
Figures
References
-
- Brunt EM. Alcoholic and nonalcoholic steatohepatitis. Clin Liver Dis 2002;6(2):399–420, vii - PubMed
-
- Forgione A, Miele L, Cefalo C, Gasbarrini G, Grieco A. Alcoholic and nonalcoholic forms of fatty liver disease. Minerva Gastroenterol Dietol 2007;53(1):83–100 - PubMed
-
- Leandro G, Mangia A, Hui J, et al. Relationship between steatosis, inflammation, and fibrosis in chronic hepatitis C: a meta-analysis of individual patient data. Gastroenterology 2006;130(6):1636–1642 - PubMed
-
- Björnsson E, Angulo P. Hepatitis C and steatosis. Arch Med Res 2007;38(6):621–627 - PubMed
-
- Negro F, Sanyal AJ. Hepatitis C virus, steatosis and lipid abnormalities: clinical and pathogenic data. Liver Int 2009;29(suppl 2):26–37 - PubMed
Publication types
MeSH terms
Substances
Grants and funding
LinkOut - more resources
Full Text Sources
Other Literature Sources
Medical
