Review
. 2011 Jan 7;108(1):70-84.
doi: 10.1161/CIRCRESAHA.110.223578.

Integrative systems models of cardiac excitation-contraction coupling

Affiliations
Review

Integrative systems models of cardiac excitation-contraction coupling

Joseph L Greenstein et al. Circ Res. .

Abstract

Excitation-contraction coupling in the cardiac myocyte is mediated by a number of highly integrated mechanisms of intracellular Ca²(+) transport. The complexity and integrative nature of heart cell electrophysiology and Ca²(+) cycling has led to an evolution of computational models that have played a crucial role in shaping our understanding of heart function. An important emerging theme in systems biology is that the detailed nature of local signaling events, such as those that occur in the cardiac dyad, have important consequences at higher biological scales. Multiscale modeling techniques have revealed many mechanistic links between microscale events, such as Ca²(+) binding to a channel protein, and macroscale phenomena, such as excitation-contraction coupling gain. Here, we review experimentally based multiscale computational models of excitation-contraction coupling and the insights that have been gained through their application.


Figures

Figure 1
Figure 1
(A) Markov state model for gating of the LCC as proposed by Jafri et al. CDI occurs as a result of downward transitions from model-normal to mode-Ca. VDI is described by an independent Hodgkin-Huxley type gate (not shown). (B) Structure of a region of the dyad containing one LCC opposed to a single RyR, and one CaM molecule tethered to the LCC.
Figure 1
Figure 1
(A) Markov state model for gating of the LCC as proposed by Jafri et al. CDI occurs as a result of downward transitions from model-normal to mode-Ca. VDI is described by an independent Hodgkin-Huxley type gate (not shown). (B) Structure of a region of the dyad containing one LCC opposed to a single RyR, and one CaM molecule tethered to the LCC.
Figure 2
Figure 2
A CICR event in a single dyad evoked by a 0 mV voltage clamp step at time zero (from73). (A) The number of free Ca2+ ions in the dyad volume as a function of time. (B) The number of open RyRs (black solid line) and the number of open LCCs (gray solid line) in the dyad during the release event depicted in panel A. (C) The average number of free Ca2+ ions in the dyad as calculated from 400 independent dyads. (D) ECC gain as a function of membrane potential for the baseline model which includes space-filling geometric models of protein structure in the dyad (solid line), for the model with protein structures excluded (dashed line), and for a modified model with dyad height reduced from 15 nm to 13 nm and protein structures excluded (dotted line).
Figure 3
Figure 3
Schematic representation of the CaRU. (A) Trigger Ca2+ influx through the LCCs enters into the T-SR cleft (dyadic space), RyRs and ClChs open, local Ca2+ passively diffuses into the cytosol, and JSR Ca2+ is refilled via passive diffusion from the NSR. (B) The T-SR cleft (shown in cross-section) is composed of four dyadic subspace volumes, arranged on a 2 × 2 grid, each containing 1 LCC, 1 ClCh, and 5 RyRs. Ca2+ in any subspace may diffuse to a neighboring subspace (Jiss) or to the cytosol (Jxfer).
Figure 3
Figure 3
Schematic representation of the CaRU. (A) Trigger Ca2+ influx through the LCCs enters into the T-SR cleft (dyadic space), RyRs and ClChs open, local Ca2+ passively diffuses into the cytosol, and JSR Ca2+ is refilled via passive diffusion from the NSR. (B) The T-SR cleft (shown in cross-section) is composed of four dyadic subspace volumes, arranged on a 2 × 2 grid, each containing 1 LCC, 1 ClCh, and 5 RyRs. Ca2+ in any subspace may diffuse to a neighboring subspace (Jiss) or to the cytosol (Jxfer).
Figure 4
Figure 4
Sample results for a single CaRU in response to a 200-ms voltage clamp to 0 mV. (A) Ca2+ flux through a single LCC (gray line) and through the set of five RyRs (black line) within a single dyadic subspace compartment. Arrows 1 and 2 highlight RyR number and Ca2+ gradient driven changes in SR Ca2+ release flux, respectively. (B) Subspace [Ca2+] associated with the events of panel A. (C) Ca2+ flux through the set of four LCCs (gray line) and the set of 20 RyRs (black line) within a single CaRU. (D). Mean subspace [Ca2+] in the four subspace compartments associated with the events in the CaRU described in panel C.
Figure 5
Figure 5
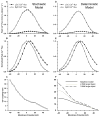
Ca2+ fluxes and ECC gain for the Greenstein-Winslow model (panels A-C) and coupled LCC-RyR model (panels D-F). (A) Mean peak LCC (filled circles) and RyR (open circles) Ca2+ flux amplitudes as a function of membrane voltage. (B) Normalized peak Ca2+ fluxes (data of panel A). (C) ECC gain under control conditions. (D) Peak LCC (filled triangles) and RyR (open triangles) Ca2+ flux amplitudes. (E) Normalized peak Ca2+ fluxes (data of panel D). (F) ECC gain for the baseline model (solid line), and models in which dyad size and number of channels per dyad is increased twofold (gray line), and threefold (dashed line).
Figure 6
Figure 6
AP and Ca2+ transients at 1-Hz steady state pacing. (A) Membrane potential (solid line, left axis), and probability that CDI and VDI (dashed and dotted lines, respectively, right axis) has not occurred as a function of time under normal conditions. (B) Cytosolic (black line, left axis) and mean subspace (gray line, right axis) Ca2+ concentrations corresponding to the AP simulated in panel A.
Figure 7
Figure 7
(A) Simulated Results from a 1-Hz AP pacing protocol under different LCC and/or RyR phosphorylation conditions. (B) APD as a function of average LCC phosphorylation levels. Fully phosphorylated LCCs gate in Mode 2 which exhibit long duration openings.

References

    1. Bers DM. Excitation-Contraction Coupling and Cardiac Contractile Force. Boston: Kluwer; 2001.
    1. Bers DM. Calcium cycling and signaling in cardiac myocytes. Annu Rev Physiol. 2008;70:23–49. - PubMed
    1. Balaban RS, Heineman FW. Control of mitochondrial respiration in the heart in vivo. Mol Cell Biochem. 1989;89:191–197. - PubMed
    1. Williams RS, Rosenberg P. Calcium-dependent gene regulation in myocyte hypertrophy and remodeling. Cold Spring Harb Symp Quant Biol. 2002;67:339–344. - PubMed
    1. Crow MT, Mani K, Nam YJ, Kitsis RN. The mitochondrial death pathway and cardiac myocyte apoptosis. Circ Res. 2004;95:957–970. - PubMed

Publication types