

Assessment of rates of structural change in glaucoma using imaging technologies
- PMID: 21212798
- PMCID: PMC3178322
- DOI: 10.1038/eye.2010.202
Assessment of rates of structural change in glaucoma using imaging technologies
Abstract
Purpose: To review the ability of current imaging technologies to provide estimates of rates of structural change in glaucoma patients.
Patients and methods: Review of literature.
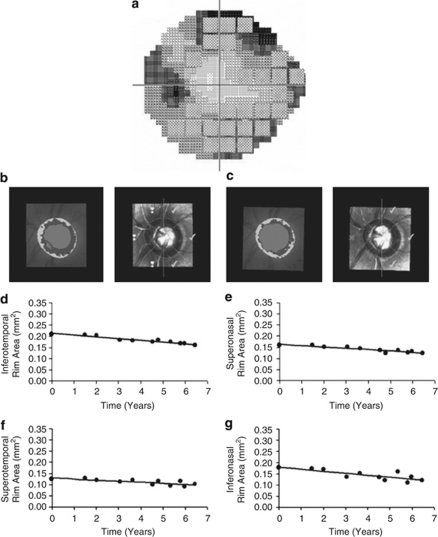
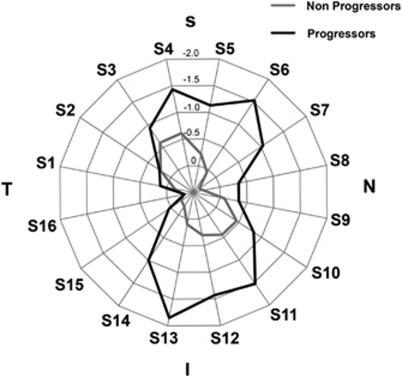
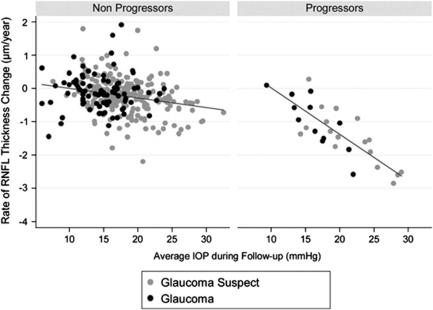
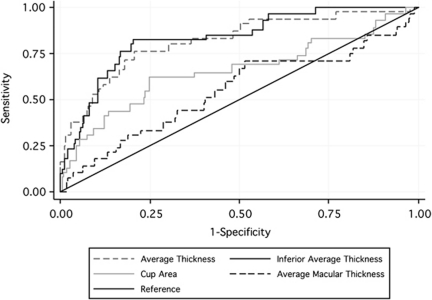
Results: Imaging technologies, such as confocal scanning laser ophthalmoscopy (CSLO), scanning laser polarimetry (SLP), and optical coherence tomography (OCT), provide quantifiable and reproducible measurements of the optic disc and parapapillary retinal nerve fibre layer (RNFL). Rates of change as quantified by the rim area (RA) (for CSLO) and RNFL thickness (for SLP and OCT) are related to glaucoma progression as detected by conventional methods (eg, visual fields and optic disc photography). Evidence shows that rates of RNFL and RA loss are significantly faster in progressing compared with non-progressing glaucoma patients.
Conclusion: Measurements of rates of optic disc and RNFL change are becoming increasingly precise and individualized. Currently available imaging technologies have the ability to detect and quantify progression in glaucoma, and their measurements may be suitable end points in glaucoma clinical trials.
Figures
References
-
- Weinreb RN, Khaw PT. Primary open-angle glaucoma. Lancet. 2004;363 (9422:1711–1720. - PubMed
-
- Medeiros FA, Susanna R, Singh K.Who should be treatedIn: Weinreb RN, Araie M, Susanna R, Goldberg I, Migdal C, Liebmann J (eds).Medical Treatment of Glaucoma Kugler Publications: Amsterdam/The Netherlands; 20101–19.
-
- Nicolela MT, McCormick TA, Drance SM, Ferrier SN, LeBlanc RP, Chauhan BC. Visual field and optic disc progression in patients with different types of optic disc damage: a longitudinal prospective study. Ophthalmology. 2003;110 (11:2178–2184. - PubMed
-
- Chauhan BC, McCormick TA, Nicolela MT, LeBlanc RP. Optic disc and visual field changes in a prospective longitudinal study of patients with glaucoma: comparison of scanning laser tomography with conventional perimetry and optic disc photography. Arch Ophthalmol. 2001;119 (10:1492–1499. - PubMed
Publication types
MeSH terms
Grants and funding
LinkOut - more resources
Full Text Sources
Other Literature Sources
Medical
