. 2011 Apr 1;435(1):175-85.
doi: 10.1042/BJ20100840.

UHRF1 depletion causes a G2/M arrest, activation of DNA damage response and apoptosis

Affiliations

UHRF1 depletion causes a G2/M arrest, activation of DNA damage response and apoptosis

Amy L Tien et al. Biochem J. .

Abstract

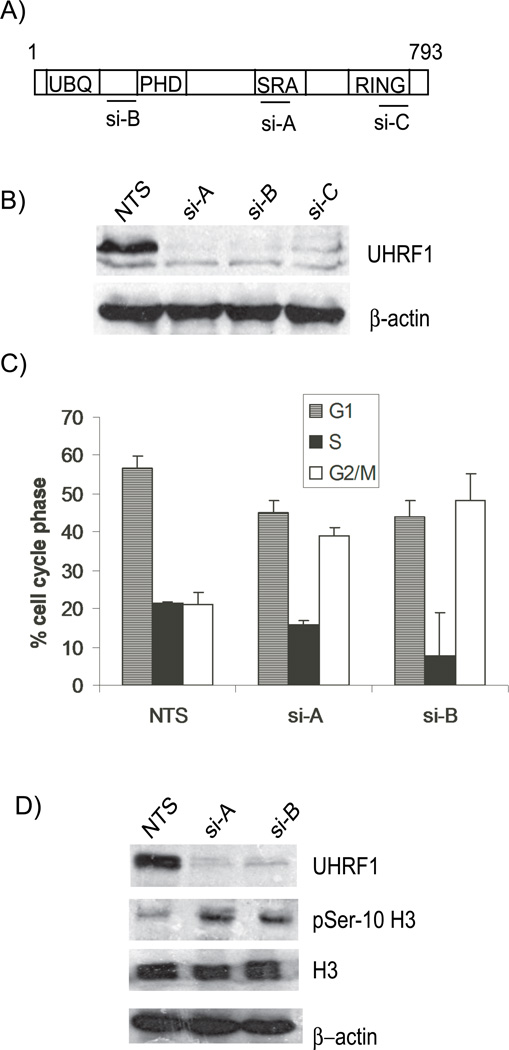
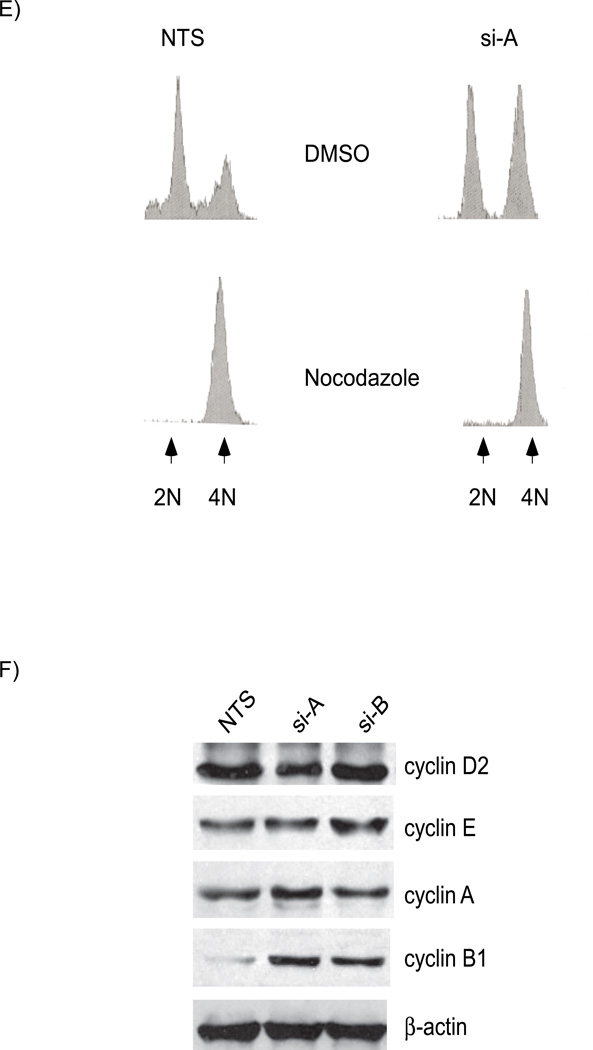
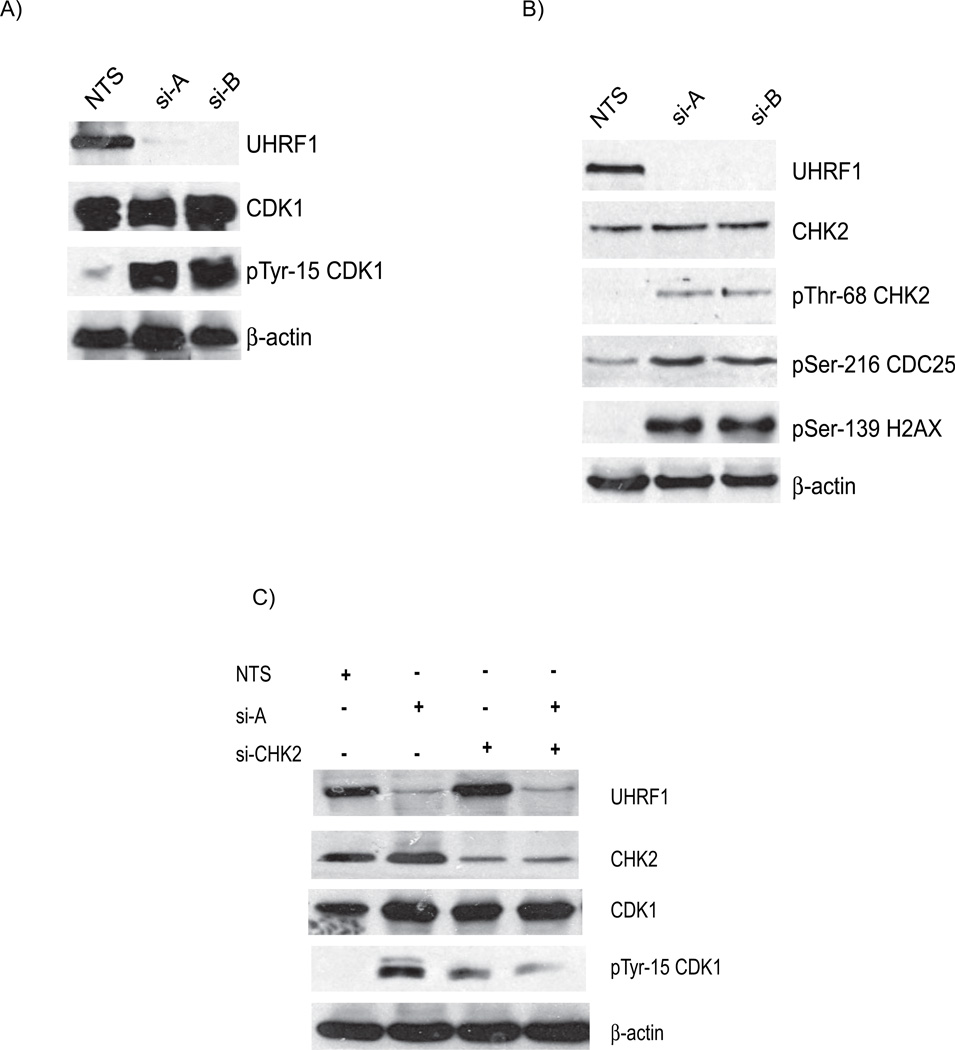
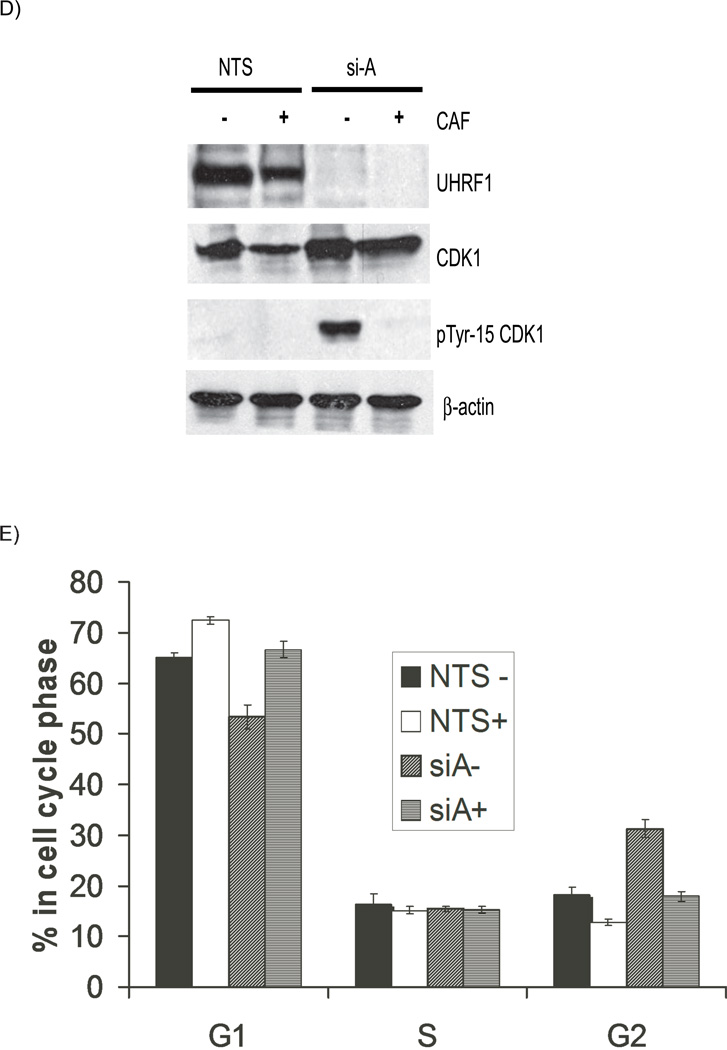
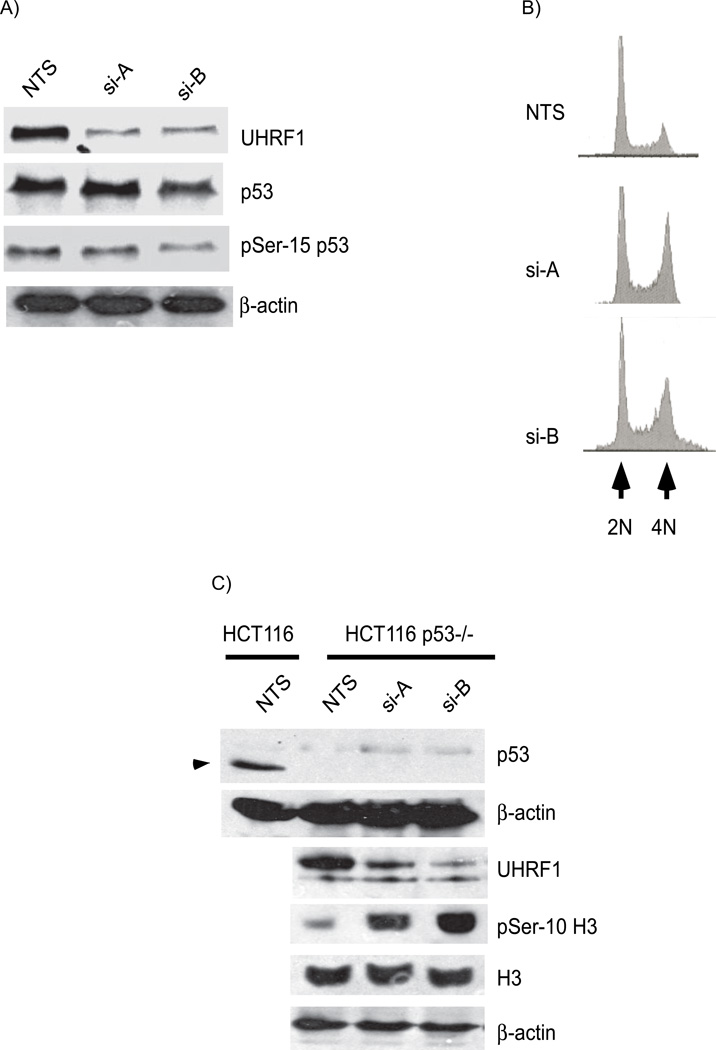
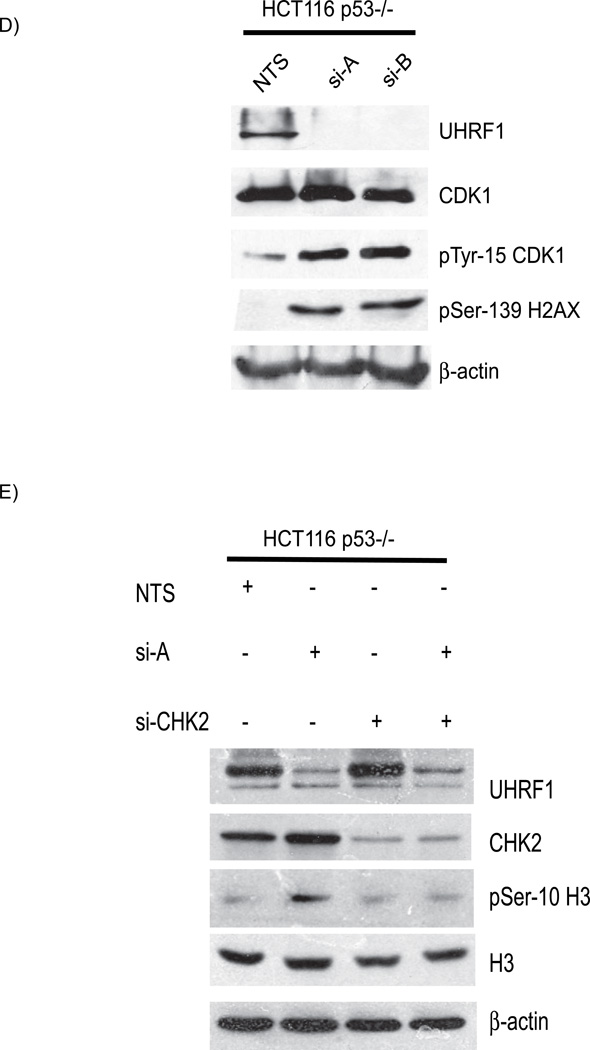
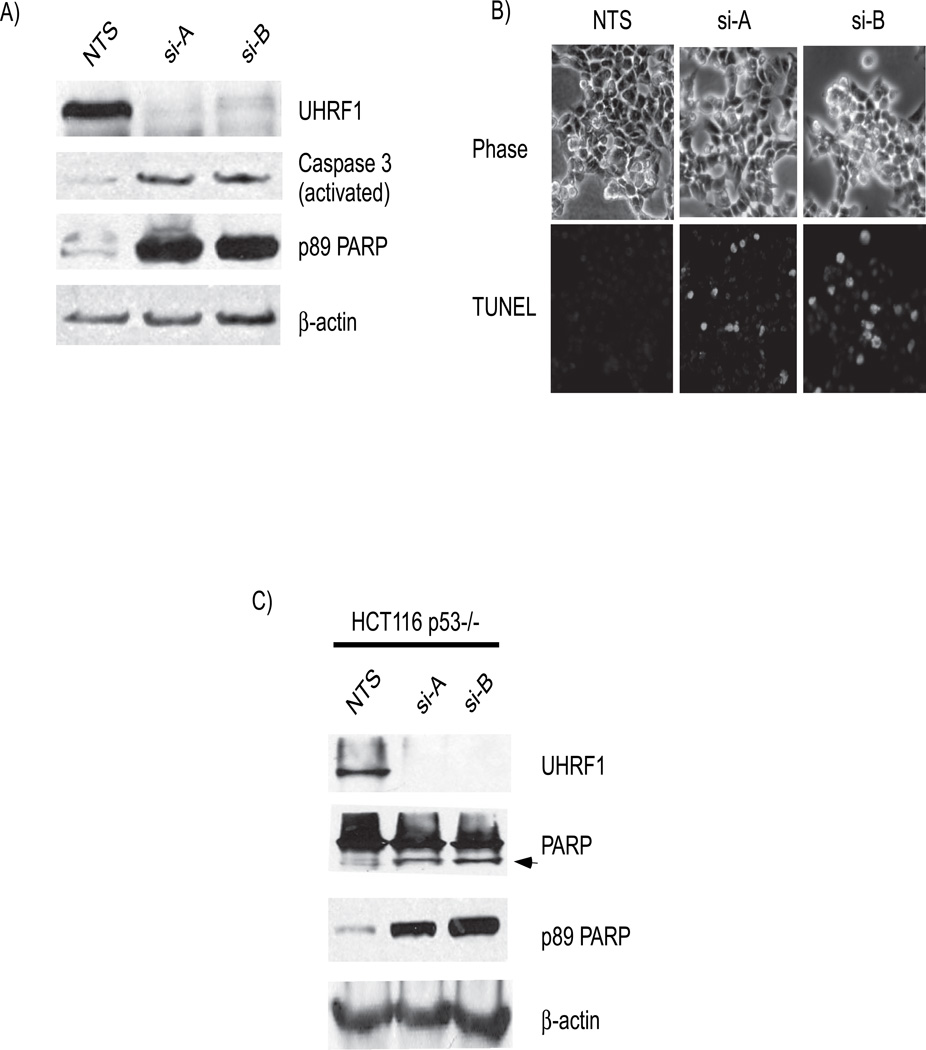
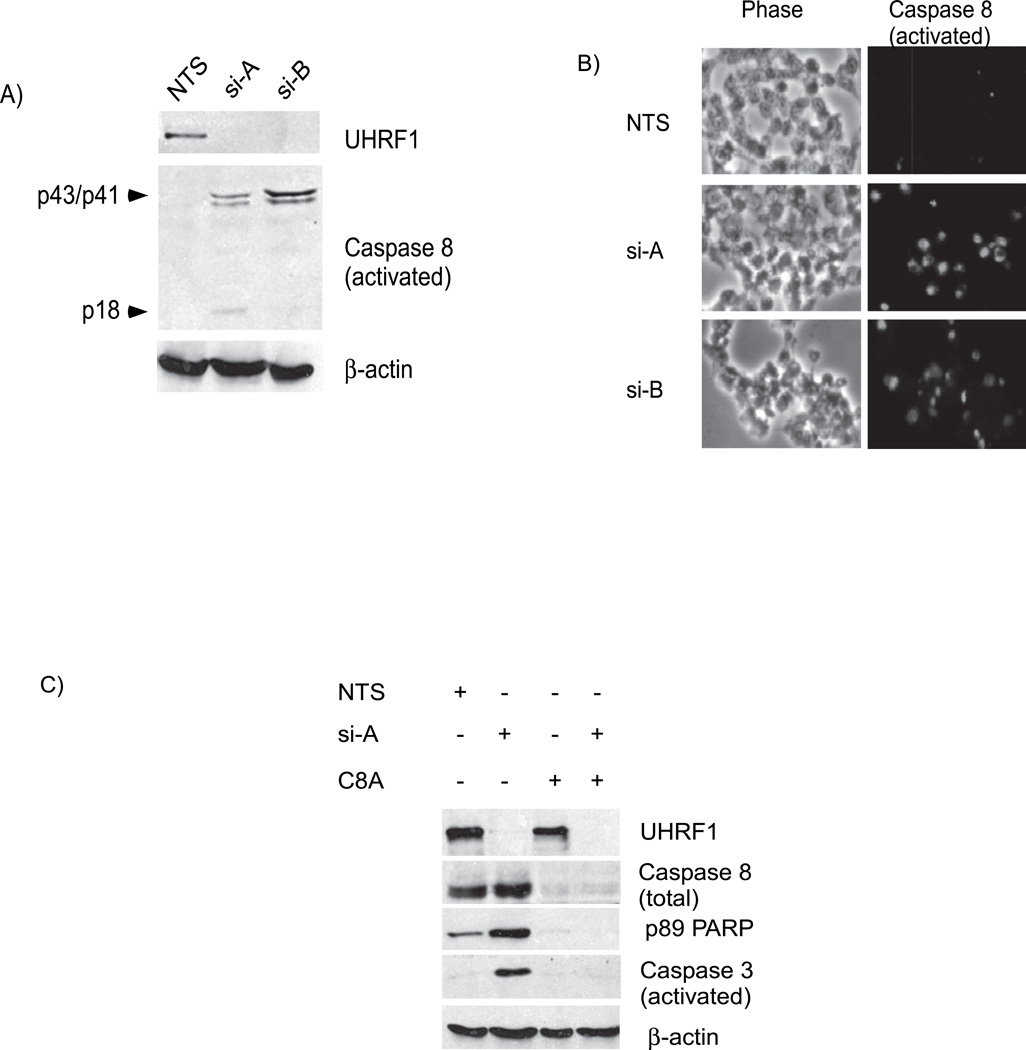
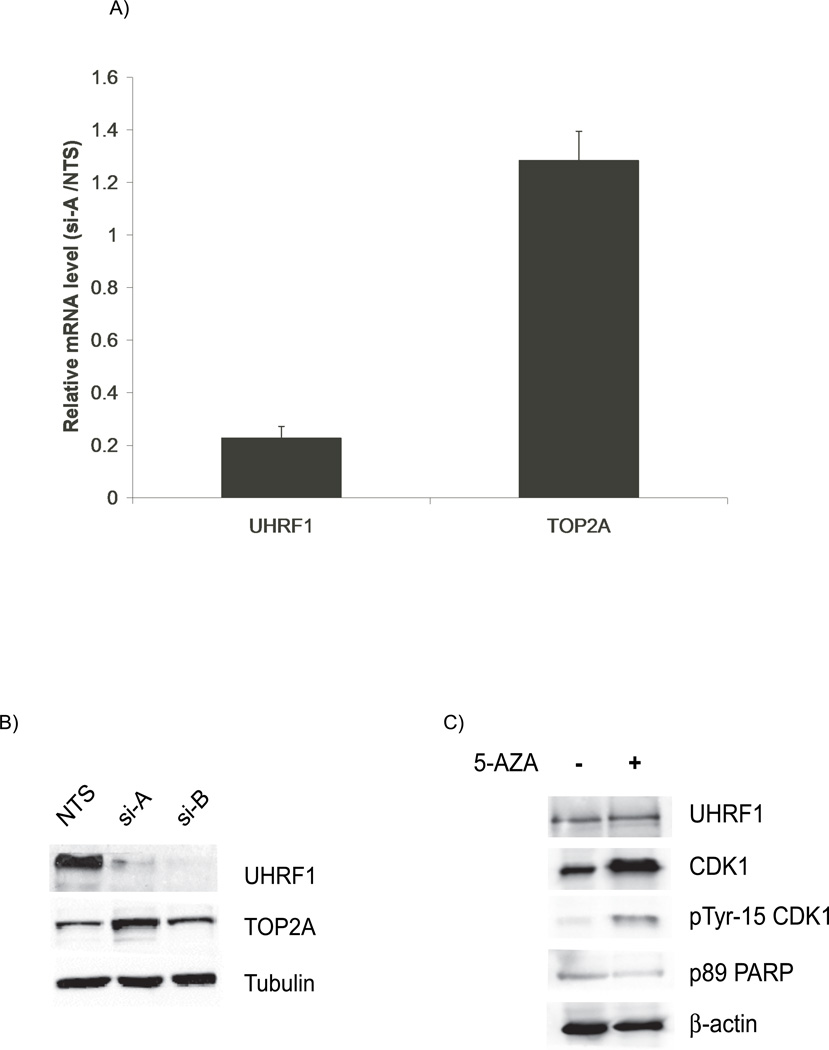
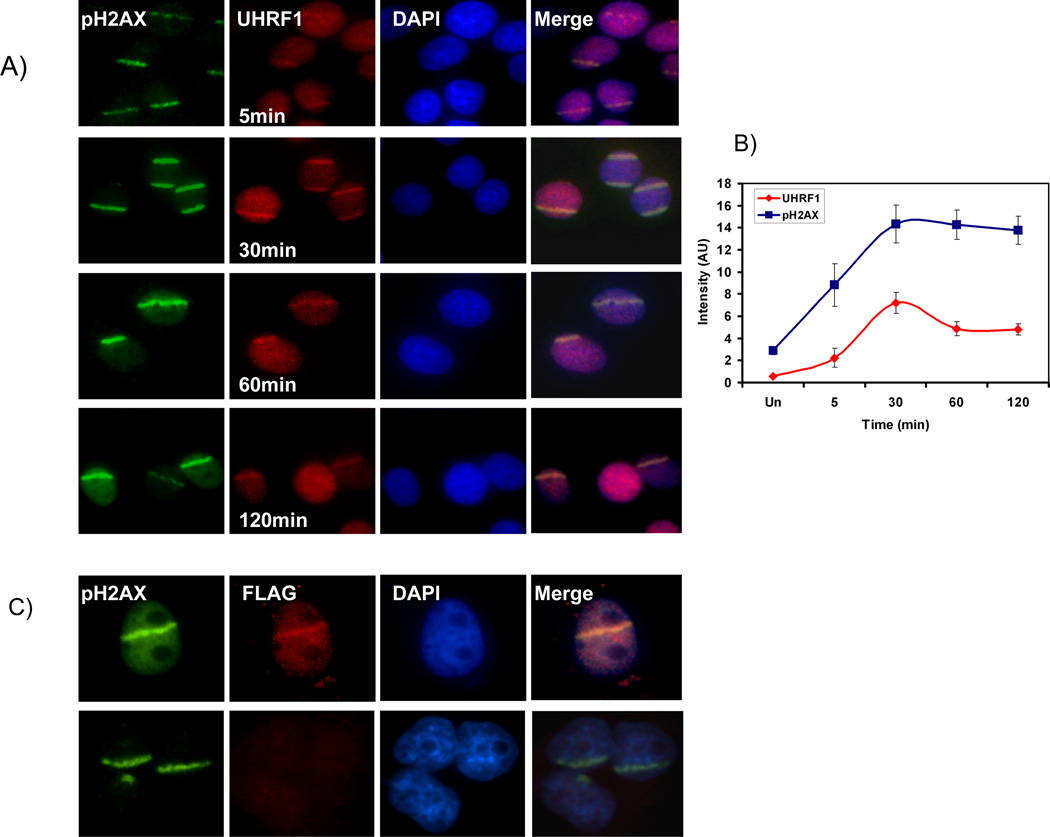
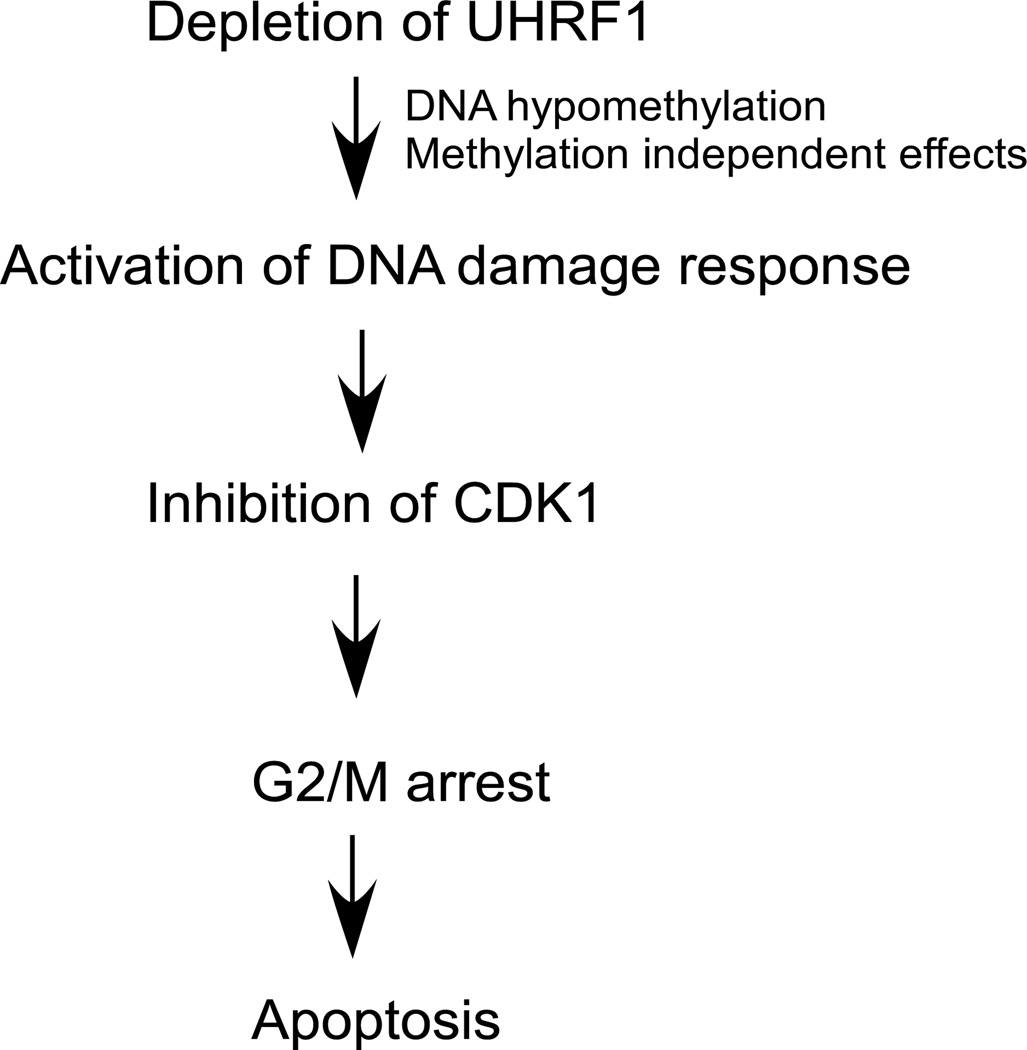
UHRF1 [ubiquitin-like protein, containing PHD (plant homeodomain) and RING finger domains 1] is required for cell cycle progression and epigenetic regulation. In the present study, we show that depleting cancer cells of UHRF1 causes activation of the DNA damage response pathway, cell cycle arrest in G2/M-phase and apoptosis dependent on caspase 8. The DNA damage response in cells depleted of UHRF1 is illustrated by: phosphorylation of histone H2AX on Ser139, phosphorylation of CHK (checkpoint kinase) 2 on Thr68, phosphorylation of CDC25 (cell division control 25) on Ser216 and phosphorylation of CDK1 (cyclin-dependent kinase 1) on Tyr15. Moreover, we find that UHRF1 accumulates at sites of DNA damage suggesting that the cell cycle block in UHRF1-depleted cells is due to an important role in damage repair. The consequence of UHRF1 depletion is apoptosis; cells undergo activation of caspases 8 and 3, and depletion of caspase 8 prevents cell death induced by UHRF1 knockdown. Interestingly, the cell cycle block and apoptosis occurs in p53-containing and -deficient cells. From the present study we conclude that UHRF1 links epigenetic regulation with DNA replication.


Figures

Figure 1
Figure 1. Depletion of UHRF1 results in a G2/M Block
A). UHRF1 is a multi-domained protein with ubiquitin, PHD, SRA and RING finger domains. The location of UHRF1 siRNAs: si-A, si-B, and si-C target are shown B). Western immunoblot of HCT116 protein lysates from cells transfected with non-targeting siRNA (NTS) or UHRF1 targeting siRNA (si-A, si-B and si-C), show efficient knockdown of UHRF1 with targeting siRNAs. C). Depletion of UHRF1 leads to a G2/M arrest. Percentage of cells in G1 (hatched), S (black) and G2/M (white) in cells transfected with NTS, si-A or si-B. Error bars represent standard deviations from the mean of three experiments. D) Enhanced serine 10 phospho histone H3 levels in UHRF1 knockdown cells. Depletion of UHRF1 (lanes 2 and 3) leads to increased levels of phosphorylated histone H3 (panel 2). Total histone H3 levels are constant. E) There is no concurrent G1 arrest in UHRF1 depleted cells. The remnant G1 population in UHRF1 containing and deficient cells (top histograms) progress to the nocodazole-induced mitotic block (bottom histograms). F) The level of G1 and S cyclins: D2, E and A remain stable in UHRF1 depleted cells (top three panels) while cyclin B1 level is elevated (panel 4). β-actin is used as a loading control for all experiments.
Figure 2
Figure 2. Depletion of UHRF1 activates the DNA damage response pathway
A). Western immunoblots show similar levels of total cellular CDK1 (panel 2) but there are enhanced levels of tyrosine 15 phosphorylated CDK1 in UHRF1 depleted cells (panel 3, compare lanes 2 and 3 with 1). B). Additional markers of DNA damage response are present in UHRF1 depleted cells. Total CHK2 is unchanged (panel 2) but CHK2 is phosphorylated on threonine-68 (panel 3), CDC25C is phosphorylated on serine-216 (panel 4) and histone H2AX is phosphorylated on serine-139 (panel 5). β-actin is used as a loading control for the experiments above. C) Knockdown of CHK2 in UHRF1 depleted cells reduces tyrosine-15 phosphorylation. The increased tyrosine-15 phosphorylation of CDK1 seen in UHRF1 depleted cells (lane 2, panel 4) is reduced when CHK2 is concurrently knocked down (lane 4, panel 4). si-CHK2 represents siRNA against CHK2. D). Caffeine abrogates the G2/M checkpoint in UHRF1 depleted cells. The marked tyrosine-15 phosphorylation of CDK1 in UHRF1 depleted cells (panel 3, lane 3) is absent in UHRF1 deficient cells treated with caffeine (CAF). CDK1 levels for NTS transfected cells are similar (panel 2, lanes 1 and 2) as well as for si-A transfected cells (panel 2, lanes 3 and 4). E) Representative FACS analysis of caffeine treated cell. Percentage of cells at various stages of the cell cycle following caffeine treatment. NTS represents UHRF1 containing cells while si-A represents UHRF1 depleted cells. + and − represent the presence or absence of caffeine. Error bars represent standard deviations from the mean of replicates. Note that caffeine abrogates the increase in G2/M population seen with UHRF1 depletion.
Figure 3
Figure 3. The cell cycle block in UHRF1 depleted cells is p53 independent
A). Western immunoblot of total p53 (panel 2) and serine-15 phophorylated p53 (panel 3). Total p53 and serine-15 p53 proteins are not increased in HCT116 cells depleted or sufficient for UHRF1. B). Representative histograms of HCT116 p53−/− cells depleted of UHRF1. Note the increased 4N DNA content in cells transfected with si-A and si-B (panel 2 and 3). C) Increased phosphohistone H3 levels in UHRF1 depleted cells. Top panel: p53 is absent in p53−/− cells (compare lanes 2, 3 and 4 with lane 1, arrow head indicates p53 in WT HCT116 cells). In p53−/− HCT116 cells, knockdown of UHRF1 increase phosphohistone H3 levels (panel 4 compare lanes 2 and 3 to 1). D) UHRF1 knockdown enhances phosphorylation of CDK1 and enhances phospho-H2AX levels (panels 3 and 4). E) CHK2 depletion in UHRF1 knockdown cells affects phosphohistone H3 levels. UHRF1 depletion increases phosphohistone H3 levels (panel 3, compare lane 1 and 2). Loss of CHK2 in UHRF1 depleted cells abrogates histone H3 phosphorylation (panel 3, compare lanes 2 and 4). si-CHK2 represents siRNA against CHK2. β-actin is used as a loading control.
Figure 4
Figure 4. UHRF1 cells undergo a p53-independent apoptosis
A). Markers of active apoptosis are present in UHRF1 depleted cells. Caspase-3 is cleaved to generate activated caspase-3 (panel 2, compares lanes 2 and 3 to 1) and PARP is cleaved (panel 4; compare lanes 2 and 3 with 1). B). TUNEL assays shows the presence of TUNEL positive cells (bottom) in UHRF1 depleted cells. Phase photographs are shown for comparison (top). C) Apoptosis also occurs in HCT116 p53−/− cells. The second panel shows both the 116 kDa and 89 kDa (arrow) moieties of PARP in UHRF1 depleted cells. Only the 116 kDa PARP is seen in the lysate from NTS transfected cells (panel 2, lane 1). Blots with an antibody that recognizes the 89 kDa fragment confirms that it is generated from PARP (panel 3).
Figure 5
Figure 5. Apoptosis in UHRF1 depleted cells occurs through the activation of caspase-8
A) Proteolytic fragments of caspase-8 representing its activated form (p43/p41 and p18) are detected in UHRF1 depleted cells but not in UHRF1 containing cells (panel 2, compare lanes 2 and 3 with 1). B). Immunofluoresence photographs (right panel, green) of UHRF1 containing and depleted cells show that activated caspase-8 is present in cells lacking UHRF1. Phase photographs are also shown for comparison (left) C) Depletion of total caspase-8 prevents PARP and caspase-3 cleavage. p89 PARP and activated caspase-3 levels increase in UHRF1 depleted but caspase-8 containing cells (panels 3 and 4, lane 2) while low in caspase-8 depleted (C8A) but UHRF1 containing cells (panels 3 and 4, lane 3). When caspase-8 in depleted in cells lacking UHRF1, PARP and caspase-3 cleavage are suppressed (panels 3 and 4, lane 4). Note that “Caspase 8” represents total caspase-8 levels while “Caspase 8 (activated)” represents proteolyzed forms of caspase-8.
Figure 6
Figure 6. Topoisomerase 2A levels are unchanged with UHRF1 depletion
A). Quantitative PCR assays shows that TOP2A mRNA levels are not decreased in UHRF1 depleted cells. UHRF1 mRNA levels are decreased by 80% for this experiment. Error bars represent standard deviations from the mean of three replicates. B). TOP2A protein levels are not decreased in UHRF1 knockdown cells. Tubulin is used as a loading control. C) UHRF1 levels remain unchanged in 5-azacytidine treated cells (top panel). Total CDK1 and Tyr 15-CDK1 also increase (panel 2 and 3) but p89 levels are not increased in 5-azacytidine treated cells (panel 4).
Figure 7
Figure 7
UHRF1 localizes to UV laser scissor induced DNA damage. A) phospho- H2AX accumulates at site of DNA damage after targeted injury (first row, green). UHRF1 is recruited to these sites within 5 minutes (second row, red), peaks in intensity at 30 minutes and then begins to fade. B) Quantitation of UHRF1 localization with pH2AX. The ratio of intensity of UHRF1 at region of laser scissors induced damage (marked by pH2AX) compared to undamaged region is plotted. Note that the change in intensity of UHRF1 staining is dynamic and differs from that of phospho-H2AX. C) Flag-UHRF1 localizes to DNA damage. Cells were transfected with Flag-UHRF1 (top panel) or empty vector (bottom panel). Cells were subjected to UV laser and processed for immunofluorescence 30 min post DNA damage with pH2AX and Flag antibodies. UHRF1 is present in the stripe in transfected cells (top, column 2) but not in control cells (bottom, column 2).
Figure 8
Figure 8
Proposed model of the effects of UHRF1 depletion in HCT116 cells.

References

    1. Zhou BB, Elledge SJ. The DNA damage response: putting checkpoints in perspective. Nature. 2000;408:433–439. - PubMed
    1. Hopfner R, Mousli M, Jeltsch JM, Voulgaris A, Lutz Y, Marin C, Bellocq JP, Oudet P, Bronner C. ICBP90, a novel human CCAAT binding protein, involved in the regulation of topoisomerase IIalpha expression. Cancer Res. 2000;60:121–128. - PubMed
    1. Bostick M, Kim JK, Esteve PO, Clark A, Pradhan S, Jacobsen SE. UHRF1 plays a role in maintaining DNA methylation in mammalian cells. Science. 2007;317:1760–1764. - PubMed
    1. Sharif J, Muto M, Takebayashi S, Suetake I, Iwamatsu A, Endo TA, Shinga J, Mizutani-Koseki Y, Toyoda T, Okamura K, Tajima S, Mitsuya K, Okano M, Koseki H. The SRA protein Np95 mediates epigenetic inheritance by recruiting Dnmt1 to methylated DNA. Nature. 2007;450:908–912. - PubMed
    1. Unoki M, Nishidate T, Nakamura Y. ICBP90, an E2F-1 target, recruits HDAC1 and binds to methyl-CpG through its SRA domain. Oncogene. 2004;23:7601–7610. - PubMed

Publication types

MeSH terms