

Paradoxical ventilator associated pneumonia incidences among selective digestive decontamination studies versus other studies of mechanically ventilated patients: benchmarking the evidence base
- PMID: 21214897
- PMCID: PMC3222036
- DOI: 10.1186/cc9406
Paradoxical ventilator associated pneumonia incidences among selective digestive decontamination studies versus other studies of mechanically ventilated patients: benchmarking the evidence base
Abstract
Introduction: Selective digestive decontamination (SDD) appears to have a more compelling evidence base than non-antimicrobial methods for the prevention of ventilator associated pneumonia (VAP). However, the striking variability in ventilator associated pneumonia-incidence proportion (VAP-IP) among the SDD studies remains unexplained and a postulated contextual effect remains untested for.
Methods: Nine reviews were used to source 45 observational (benchmark) groups and 137 component (control and intervention) groups of studies of SDD and studies of three non-antimicrobial methods of VAP prevention. The logit VAP-IP data were summarized by meta-analysis using random effects methods and the associated heterogeneity (tau2) was measured. As group level predictors of logit VAP-IP, the mode of VAP diagnosis, proportion of trauma admissions, the proportion receiving prolonged ventilation and the intervention method under study were examined in meta-regression models containing the benchmark groups together with either the control (models 1 to 3) or intervention (models 4 to 6) groups of the prevention studies.
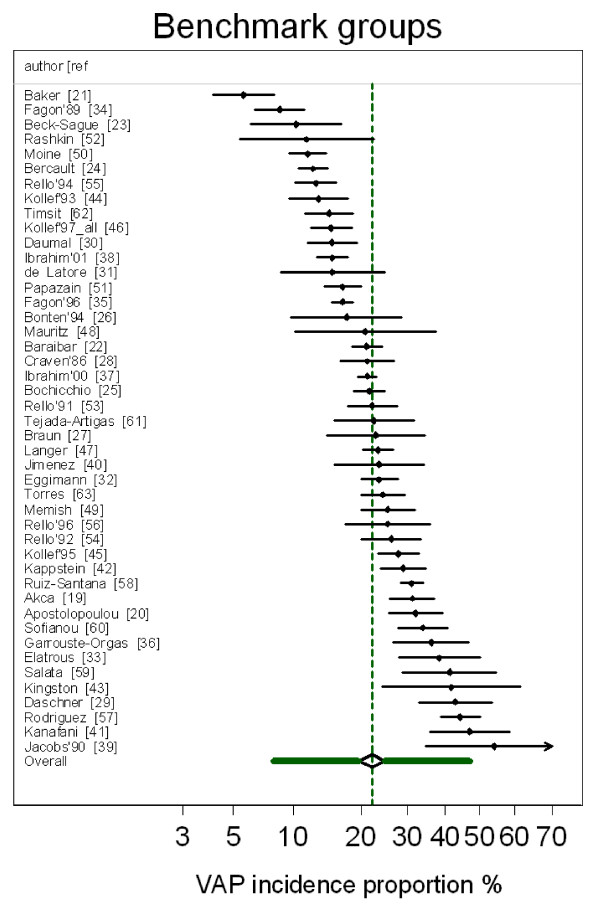
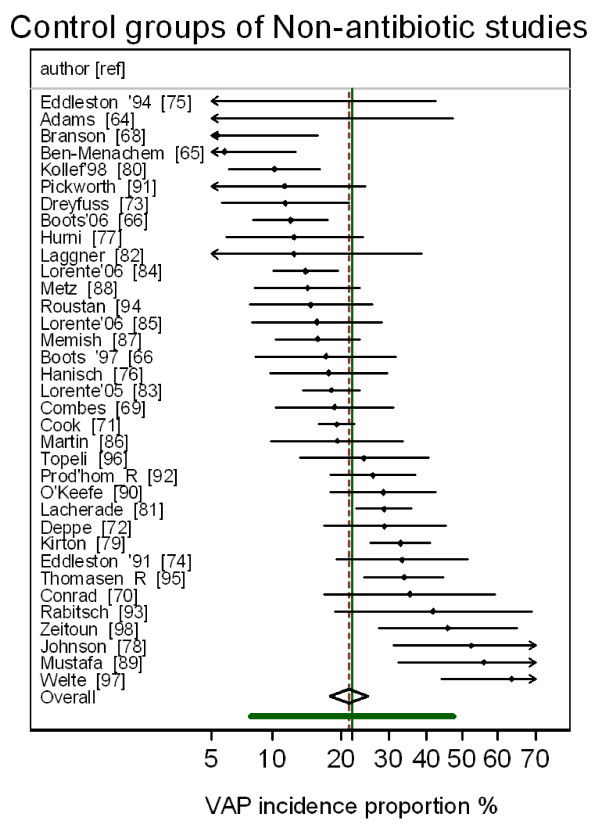
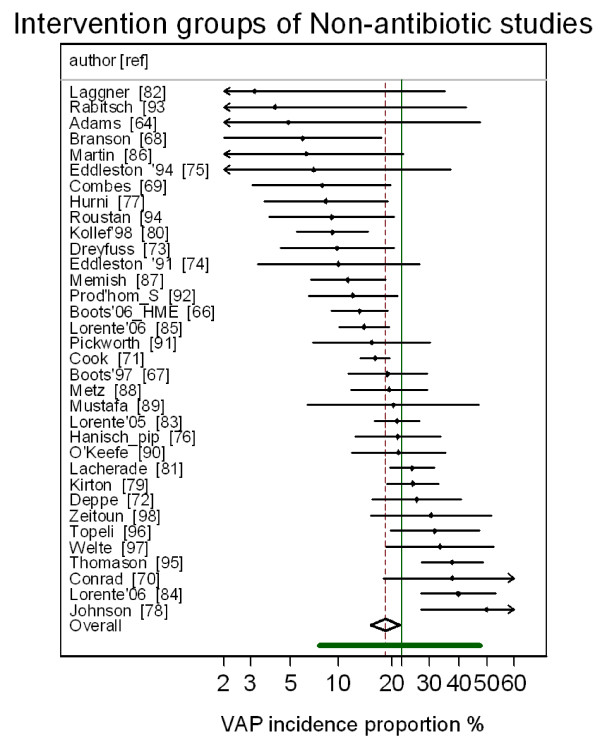
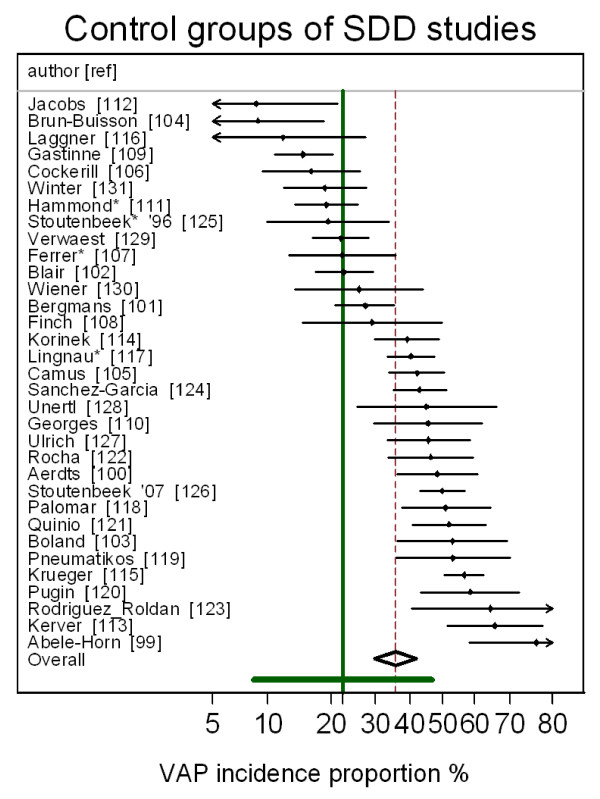
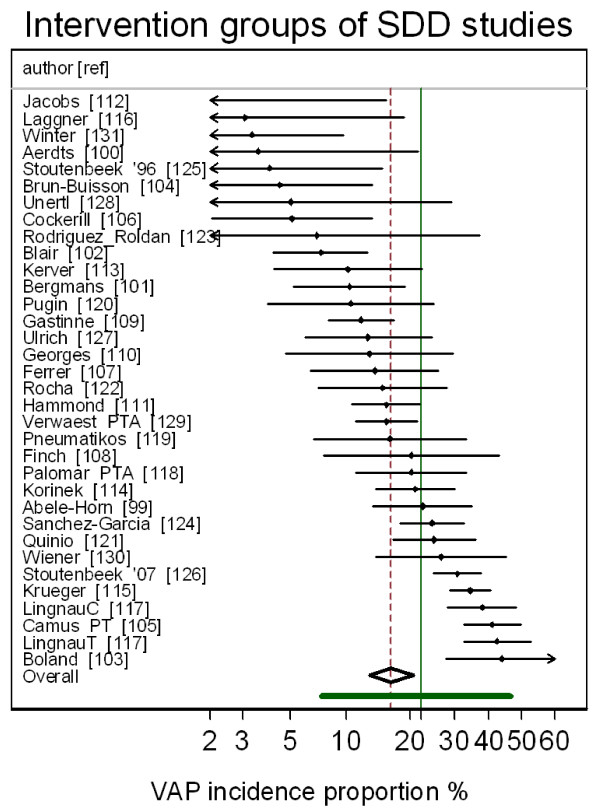
Results: The VAP-IP benchmark derived here is 22.1% (95% confidence interval; 95% CI; 19.2 to 25.5; tau2 0.34) whereas the mean VAP-IP of control groups from studies of SDD and of non-antimicrobial methods, is 35.7 (29.7 to 41.8; tau2 0.63) versus 20.4 (17.2 to 24.0; tau2 0.41), respectively (P < 0.001). The disparity between the benchmark groups and the control groups of the SDD studies, which was most apparent for the highest quality studies, could not be explained in the meta-regression models after adjusting for various group level factors. The mean VAP-IP (95% CI) of intervention groups is 16.0 (12.6 to 20.3; tau2 0.59) and 17.1 (14.2 to 20.3; tau2 0.35) for SDD studies versus studies of non-antimicrobial methods, respectively.
Conclusions: The VAP-IP among the intervention groups within the SDD evidence base is less variable and more similar to the benchmark than among the control groups. These paradoxical observations cannot readily be explained. The interpretation of the SDD evidence base cannot proceed without further consideration of this contextual effect.
Figures
Similar articles
-
Topical antibiotics as a major contextual hazard toward bacteremia within selective digestive decontamination studies: a meta-analysis.BMC Infect Dis. 2014 Dec 31;14:714. doi: 10.1186/s12879-014-0714-x. BMC Infect Dis. 2014. PMID: 25551776 Free PMC article. Review.
-
The perfidious effect of topical placebo: calibration of Staphylococcus aureus ventilator-associated pneumonia incidence within selective digestive decontamination studies versus the broader evidence base.Antimicrob Agents Chemother. 2013 Sep;57(9):4524-31. doi: 10.1128/AAC.00424-13. Epub 2013 Jul 8. Antimicrob Agents Chemother. 2013. PMID: 23836178 Free PMC article.
-
Unusually High Incidences of Staphylococcus aureus Infection within Studies of Ventilator Associated Pneumonia Prevention Using Topical Antibiotics: Benchmarking the Evidence Base.Microorganisms. 2018 Jan 4;6(1):2. doi: 10.3390/microorganisms6010002. Microorganisms. 2018. PMID: 29300363 Free PMC article.
-
Paradoxical Acinetobacter-associated ventilator-associated pneumonia incidence rates within prevention studies using respiratory tract applications of topical polymyxin: benchmarking the evidence base.J Hosp Infect. 2018 Sep;100(1):105-113. doi: 10.1016/j.jhin.2018.04.005. Epub 2018 Apr 10. J Hosp Infect. 2018. PMID: 29649555
-
Ventilator-associated pneumonia prevention methods using topical antibiotics: herd protection or herd peril?Chest. 2014 Oct;146(4):890-898. doi: 10.1378/chest.13-2926. Chest. 2014. PMID: 25287997 Review.
Cited by
-
Management of Pseudomonas aeruginosa pneumonia: one size does not fit all.Crit Care. 2014 Apr 29;18(2):136. doi: 10.1186/cc13849. Crit Care. 2014. PMID: 25029571 Free PMC article.
-
Impact of selective digestive decontamination on respiratory tract Candida among patients with suspected ventilator-associated pneumonia. A meta-analysis.Eur J Clin Microbiol Infect Dis. 2016 Jul;35(7):1121-35. doi: 10.1007/s10096-016-2643-7. Epub 2016 Apr 26. Eur J Clin Microbiol Infect Dis. 2016. PMID: 27116009
-
Incidence of coagulase-negative staphylococcal bacteremia among ICU patients: decontamination studies as a natural experiment.Eur J Clin Microbiol Infect Dis. 2020 Apr;39(4):657-664. doi: 10.1007/s10096-019-03763-0. Epub 2019 Dec 4. Eur J Clin Microbiol Infect Dis. 2020. PMID: 31802335 Free PMC article.
-
Unusually High Incidences of Pseudomonas Bacteremias Within Topical Polymyxin-Based Decolonization Studies of Mechanically Ventilated Patients: Benchmarking the Literature.Open Forum Infect Dis. 2018 Oct 10;5(11):ofy256. doi: 10.1093/ofid/ofy256. eCollection 2018 Nov. Open Forum Infect Dis. 2018. PMID: 30465011 Free PMC article.
-
Year in review 2011: Critical Care--Resource management.Crit Care. 2012 Dec 10;16(6):244. doi: 10.1186/cc11821. Crit Care. 2012. PMID: 23256851 Free PMC article. Review.
References
-
- Chastre J, Fagon JY. Ventilator-associated pneumonia. Am J Respir Crit Care Med. 2002;165:867–903. - PubMed
-
- Bergmans DCJJ, Bonten MJM. In: Hospital Epidemiology and Infection Control. 3. Mayhall CG, editor. Philadelphia: Lippincott Williams & Wilkins; 2004. Nosocomial pneumonia; pp. 311–339.
Publication types
MeSH terms
LinkOut - more resources
Full Text Sources
Research Materials
