. 2011 Jan 7:12:14.
doi: 10.1186/1471-2164-12-14.

Expression of G protein-coupled receptors and related proteins in HEK293, AtT20, BV2, and N18 cell lines as revealed by microarray analysis

Affiliations

Expression of G protein-coupled receptors and related proteins in HEK293, AtT20, BV2, and N18 cell lines as revealed by microarray analysis

Brady K Atwood et al. BMC Genomics. .

Abstract

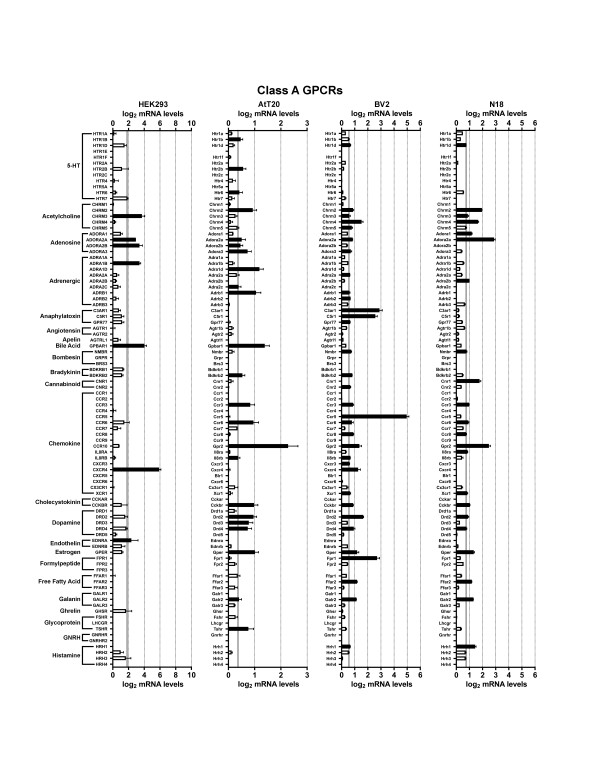
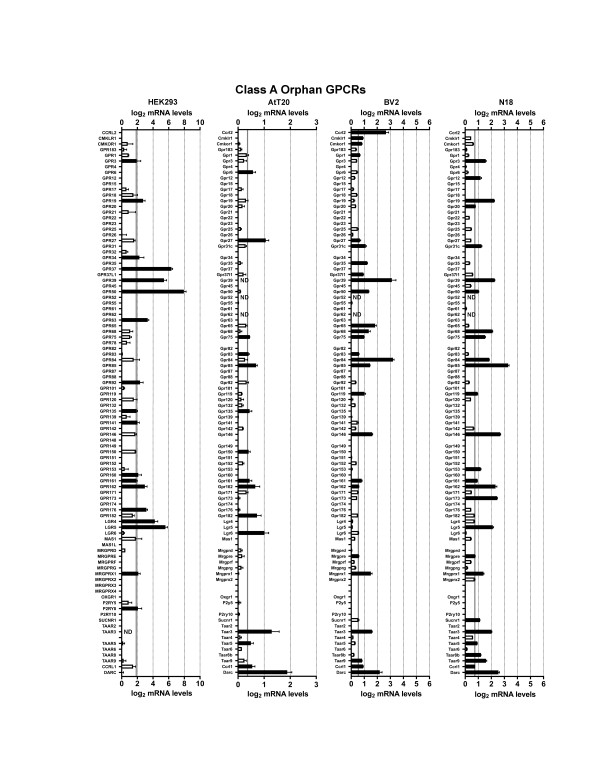
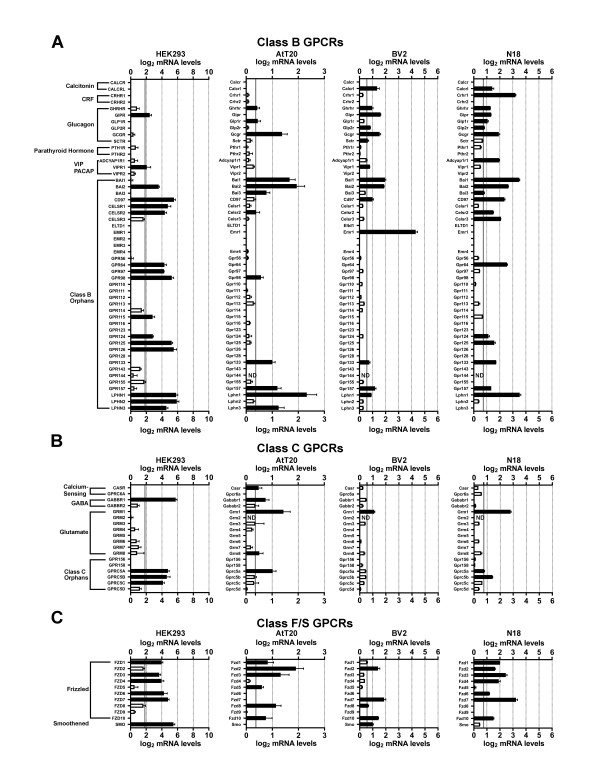
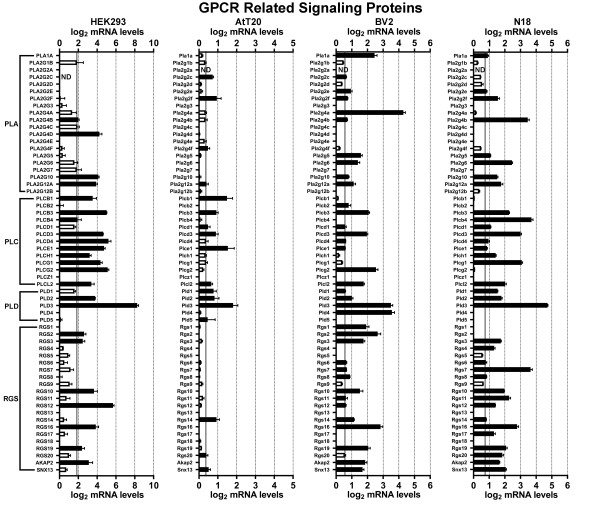
Background: G protein coupled receptors (GPCRs) are one of the most widely studied gene superfamilies. Thousands of GPCR research studies have utilized heterologous expression systems such as human embryonic kidney cells (HEK293). Though often treated as 'blank slates', these cell lines nevertheless endogenously express GPCRs and related signaling proteins. The outcome of a given GPCR study can be profoundly influenced by this largely unknown complement of receptors and/or signaling proteins. Little easily accessible information exists that describes the expression profiles of the GPCRs in cell lines. What is accessible is often limited in scope - of the hundreds of GPCRs and related proteins, one is unlikely to find information on expression of more than a dozen proteins in a given cell line. Microarray technology has allowed rapid analysis of mRNA levels of thousands of candidate genes, but though often publicly available, the results can be difficult to efficiently access or even to interpret.

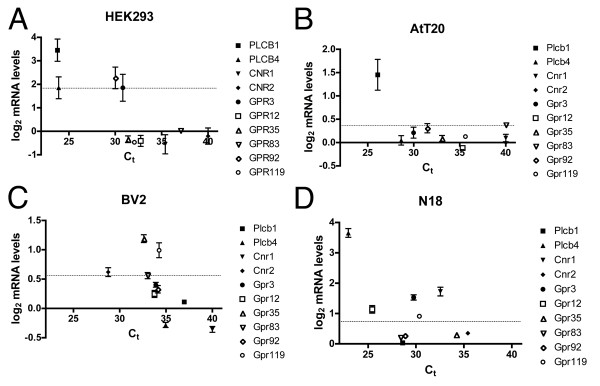
Results: To bridge this gap, we have used microarrays to measure the mRNA levels of a comprehensive profile of non-chemosensory GPCRs and over a hundred GPCR signaling related gene products in four cell lines frequently used for GPCR research: HEK293, AtT20, BV2, and N18.

Conclusions: This study provides researchers an easily accessible mRNA profile of the endogenous signaling repertoire that these four cell lines possess. This will assist in choosing the most appropriate cell line for studying GPCRs and related signaling proteins. It also provides a better understanding of the potential interactions between GPCRs and those signaling proteins.


Figures

Figure 1
Figure 1
mRNA expression levels of Class A GPCRs. Microarray analysis of mRNA levels of Class A GPCRs with known ligands for HEK293, AtT20, BV2 and N18 cell lines. The gray line indicates the threshold of statistical significance and the dark bars are proteins for which statistically significant levels of mRNA were detected. White bars indicate levels of mRNA for proteins that were present, but did not reach statistical significance. Abbreviation: 5-HT = 5-hydroxytryptamine; GNRH = Gonadotrophin-releasing hormone.
Figure 2
Figure 2
mRNA expression levels of Class A GPCRs. Microarray analysis of mRNA levels of Class A GPCRs with known ligands for HEK293, AtT20, BV2 and N18 cell lines. The gray line indicates the threshold of statistical significance and the dark bars are proteins for which statistically significant levels of mRNA were detected. White bars indicate levels of mRNA for proteins that were present, but did not reach statistical significance. Abbreviation: MCH = Melanin-concentrating hormone; TRH = Thyrotropin-releasing hormone.
Figure 3
Figure 3
mRNA expression levels of Class A Orphan GPCRs. Microarray analysis of mRNA levels of Class A GPCRs with unknown ligands for HEK293, AtT20, BV2 and N18 cell lines. The gray line indicates the threshold of statistical significance and the dark bars are proteins for which statistically significant levels of mRNA were detected. White bars indicate levels of mRNA for proteins that were present, but did not reach statistical significance. Abbreviation: ND = not determined.
Figure 4
Figure 4
mRNA expression levels of Class B, C, and F/S GPCRs. Microarray analysis of mRNA levels of GPCRs with known ligands for HEK293, AtT20, BV2 and N18 cell lines. A: Class B GPCRs. B: Class C GPCRs. C: Class F/S GPCRs. The gray lines indicate the threshold of statistical significance and the dark bars are proteins for which statistically significant levels of mRNA were detected. White bars indicate levels of mRNA for proteins that were present, but did not reach statistical significance. Abbreviations: BAI = Brain-specific angiogenesis inhibitor; CELSR = Cadherin EGF LAG seven-pass G-type receptor; CRF = Corticotropin-releasing factor; ND = Not determined; PACAP = pituitary adenylyl cyclase-activating polypeptide; VIP = Vasoactive intestinal peptide.
Figure 5
Figure 5
mRNA expression analysis of GPCR related signaling proteins. Microarray analysis of mRNA levels of GPCR related signaling proteins for HEK293, AtT20, BV2 and N18 cell lines. The gray lines indicate the threshold of statistical significance and the dark bars are proteins for which statistically significant levels of mRNA were detected. White bars indicate levels of mRNA for proteins that were present, but did not reach statistical significance. Abbreviations: GRK = GPCR Kinase; PKA = Protein kinase A; PKC = Protein kinase C.
Figure 6
Figure 6
mRNA expression analysis of GPCR related signaling proteins. Microarray analysis of mRNA levels of GPCR related signaling proteins for HEK293, AtT20, BV2 and N18 cell lines. The gray lines indicate the threshold of statistical significance and the dark bars are proteins for which statistically significant levels of mRNA were detected. White bars indicate levels of mRNA for proteins that were present, but did not reach statistical significance. Abbreviations: ND = Not determined; PLA = Phospolipase A; PLC = Phospholipase C; PLD = Phospholipase D; RGS = Regulator of G protein signaling.
Figure 7
Figure 7
Quantitative polymerase chain reaction validation of microarray analysis. Quantitative PCR analysis of 10 genes from (A) HEK293, (B) AtT20, (C) BV2, and (D) N18 cell lines. mRNA levels determined from qPCR analysis were plotted against the mRNA levels measured in the microarray analyses in figures 1, 3 and 6. The dashed lines indicate the threshold of statistical significance for the microarray data. Points that fall between 0 and this threshold indicate genes that were detected with the microarray analysis but failed to meet statistical significance. Lower critical threshold (Ct) values indicate high mRNA copy numbers.

References

    1. Levoye A, Dam J, Ayoub MA, Guillaume JL, Jockers R. Do orphan G-protein-coupled receptors have ligand-independent functions? New insights from receptor heterodimers. EMBO Rep. 2006;7(11):1094–1098. doi: 10.1038/sj.embor.7400838. - DOI - PMC - PubMed
    1. Jacoby E, Bouhelal R, Gerspacher M, Seuwen K. The 7 TM G-protein-coupled receptor target family. ChemMedChem. 2006;1(8):761–782. doi: 10.1002/cmdc.200600134. - DOI - PubMed
    1. Davies MN, Secker A, Freitas AA, Mendao M, Timmis J, Flower DR. On the hierarchical classification of G protein-coupled receptors. Bioinformatics. 2007;23(23):3113–3118. doi: 10.1093/bioinformatics/btm506. - DOI - PubMed
    1. Davies MN, Gloriam DE, Secker A, Freitas AA, Mendao M, Timmis J, Flower DR. Proteomic applications of automated GPCR classification. Proteomics. 2007;7(16):2800–2814. doi: 10.1002/pmic.200700093. - DOI - PubMed
    1. Davies MN, Secker A, Halling-Brown M, Moss DS, Freitas AA, Timmis J, Clark E, Flower DR. GPCRTree: online hierarchical classification of GPCR function. BMC Res Notes. 2008;1:67. doi: 10.1186/1756-0500-1-67. - DOI - PMC - PubMed

Publication types

Substances