Comparative Study
. 2011 Jan 9:4:3.
doi: 10.1186/1755-8794-4-3.

Building prognostic models for breast cancer patients using clinical variables and hundreds of gene expression signatures

Affiliations
Comparative Study

Building prognostic models for breast cancer patients using clinical variables and hundreds of gene expression signatures

Cheng Fan et al. BMC Med Genomics. .

Abstract

Background: Multiple breast cancer gene expression profiles have been developed that appear to provide similar abilities to predict outcome and may outperform clinical-pathologic criteria; however, the extent to which seemingly disparate profiles provide additive prognostic information is not known, nor do we know whether prognostic profiles perform equally across clinically defined breast cancer subtypes. We evaluated whether combining the prognostic powers of standard breast cancer clinical variables with a large set of gene expression signatures could improve on our ability to predict patient outcomes.

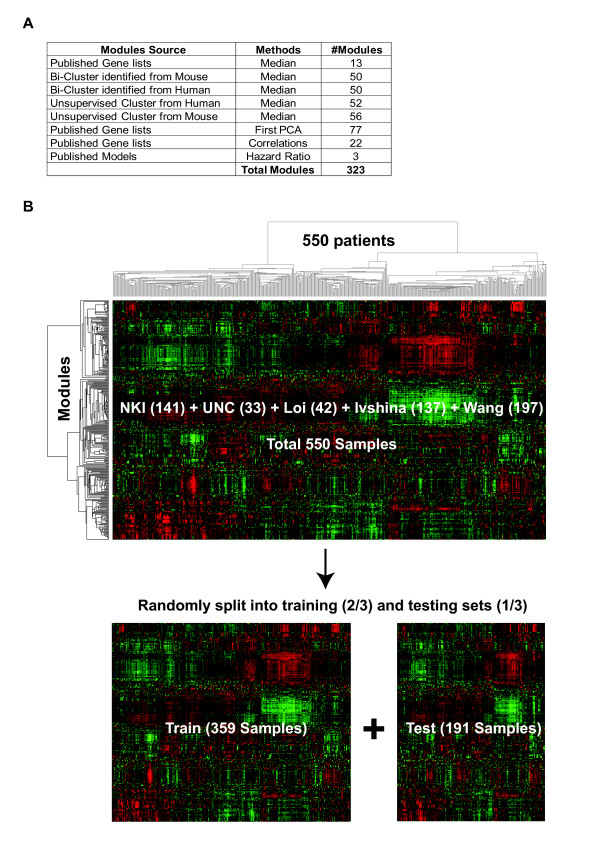
Methods: Using clinical-pathological variables and a collection of 323 gene expression "modules", including 115 previously published signatures, we build multivariate Cox proportional hazards models using a dataset of 550 node-negative systemically untreated breast cancer patients. Models predictive of pathological complete response (pCR) to neoadjuvant chemotherapy were also built using this approach.

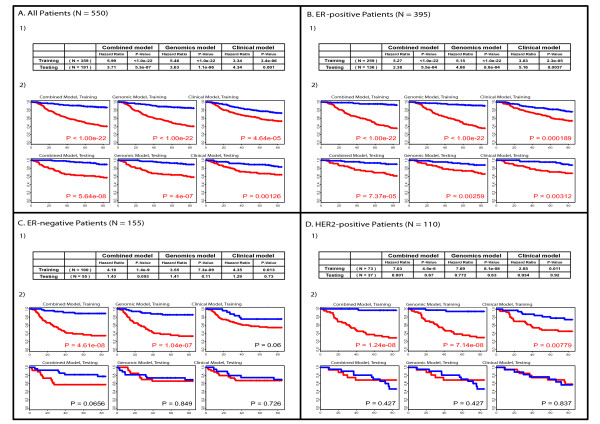
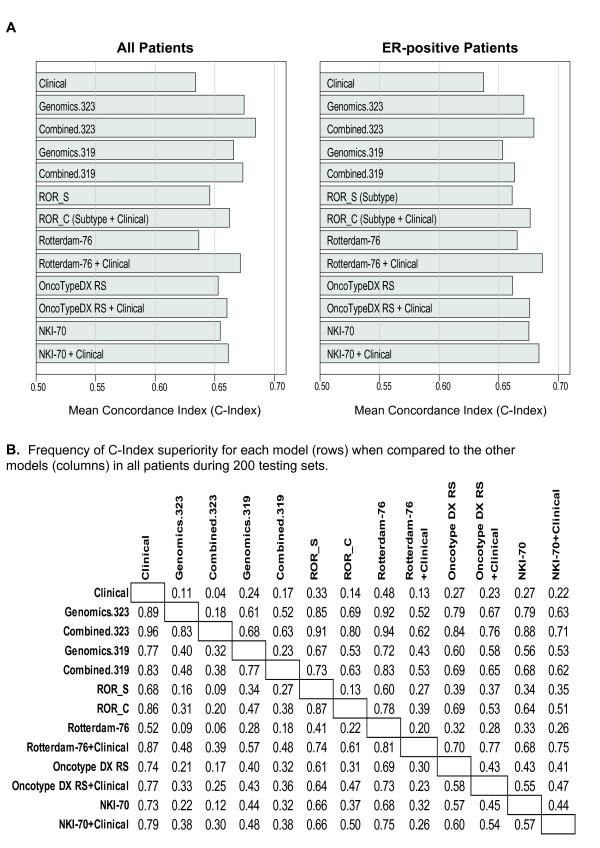
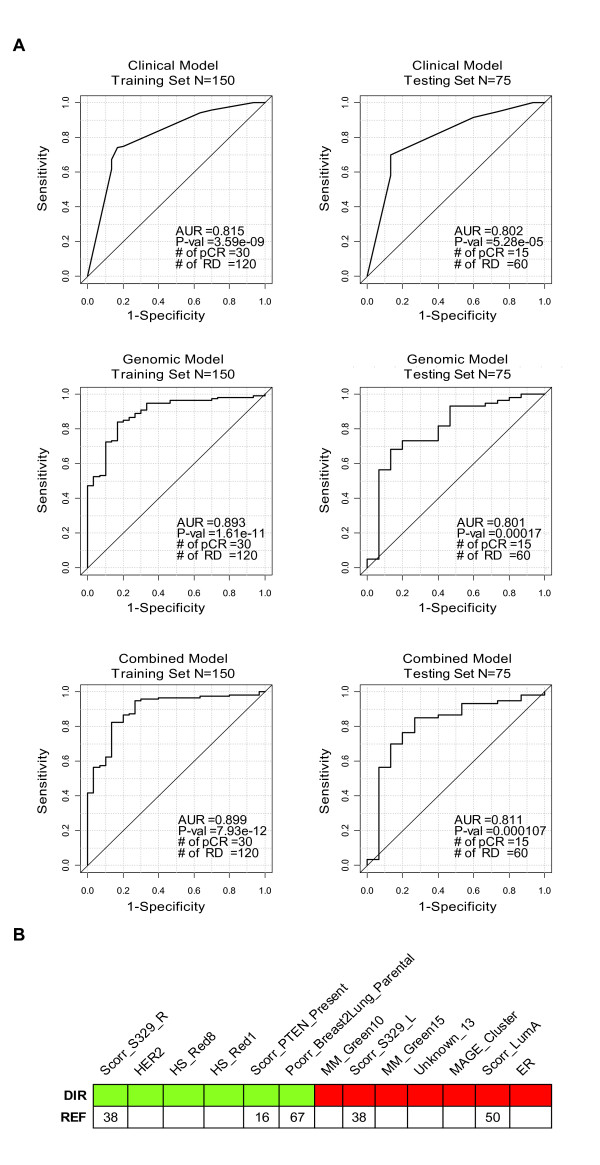
Results: We identified statistically significant prognostic models for relapse-free survival (RFS) at 7 years for the entire population, and for the subgroups of patients with ER-positive, or Luminal tumors. Furthermore, we found that combined models that included both clinical and genomic parameters improved prognostication compared with models with either clinical or genomic variables alone. Finally, we were able to build statistically significant combined models for pathological complete response (pCR) predictions for the entire population.

Conclusions: Integration of gene expression signatures and clinical-pathological factors is an improved method over either variable type alone. Highly prognostic models could be created when using all patients, and for the subset of patients with lymph node-negative and ER-positive breast cancers. Other variables beyond gene expression and clinical-pathological variables, like gene mutation status or DNA copy number changes, will be needed to build robust prognostic models for ER-negative breast cancer patients. This combined clinical and genomics model approach can also be used to build predictors of therapy responsiveness, and could ultimately be applied to other tumor types.


Figures

Figure 1
Figure 1
Kaplan-Meier survival estimates of relapse-free survival (RFS) among 550 patients, according to tumor size, clinical estrogen receptor (ER) status, HER2 mRNA status, and histological grade. P-values were obtained from the log-rank test, and (+) denotes observations that were censored owing to loss to follow-up or on the date of last contact.
Figure 2
Figure 2
Depiction of the combined breast tumor dataset. (A) Table summarizing the different approaches used to obtain the various modules. PCA, principal component analysis. (B) Hierarchical cluster analysis of 323 gene expression modules (rows) across the microarray data of 550 node-negative breast cancer patients (columns). All samples were stratified by source, platform and clinical variables, and randomly split into a training (~2/3) and testing (~1/3) sets.
Figure 3
Figure 3
Survival prediction analyses of the different Cox models. (A) Models for all patients; (B) Models for ER-positive patients; (C) Model for ER-negative patients; (D) Models for HER2-positive patients. 1) Hazard ratio and p-value of the Cox proportional hazard model (Cox-model), for both the training and testing sets, respectively; 2) Kaplan-Meier survival estimates of relapse-free survival (RFS) among training and testing sets, respectively, according to each model. Patients were stratified into high-risk (red curve) and low-risk (blue curves) groups based on their respective risk score, which was defined as the natural logarithm of the hazard ratio. The chosen cut-off value for stratification into high and low-risk groups was zero. P-values were obtained from the log-rank test. + denotes observations that were censored owing to loss to follow-up or last contact.
Figure 4
Figure 4
Most frequently selected modules and clinical variables that build successful combined models for all patients (A) and ER-positive patients (B). Modules in blue identify those modules and/or clinical variables that were evaluated in the combined model in Fig. 2. Colored squares identify the modules and/or clinical variables association with either poor (red) or good (green) prognosis. Freq, frequency of selection of a particular module/clinical variable among 200 successful models; Ref, references of previously published modules.
Figure 5
Figure 5
C-Index evaluations of the various models analyzed. (A) Performance of clinical, genomic and combined models in the testing sets of all patients and ER-positive patients. Each patient subset was randomly split into a training set (~2/3 of cases) and a testing set (~1/3 of cases). We then used the model built from the training set to calculate the C-index of the testing set. We repeated this procedure 200 times and then calculated the mean of the C-index for each model. The performance of established prognostic predictors (OncoTypeDX RS, NKI 70-gene signature, 76-gene Rotterdam index, the risk of relapse based on intrinsic subtyping [ROR_S]) with or without the addition of clinical variables was also estimated. (B) Frequency of superiority of the C-Index for each model (rows) when compared to the other models (columns) in 200 testing sets of all patients. Each row represents a model, which is then compared to all other models/columns, where a higher number indicates that the row model was superior to the model in the column that fraction of the 200 times tested.
Figure 6
Figure 6
Integration of clinical and genomic variables to predict pathological complete response (pCR) after anthracycline/taxane-based chemotherapy using Popovici et al. dataset (n = 225). (A) Area under the receiver operating characteristic curve (AUC) for clinical, genomic and combined models in the training and testing sets. (B) Modules and clinical variables that built the combined model evaluated in section (A). Colored squares identify the modules and/or clinical variables association with pCR (red) or non-pCR (green), respectively. Ref, references of previously published modules. Note: Response_Predictor_MDACC, OncoTypeDX RS, NKI 70-gene signature, 76-gene Rotterdam index and ROR-S have been removed for this analysis.

References

    1. Massague J. Sorting out breast-cancer gene signatures. N Engl J Med. 2007;356(3):294–297. doi: 10.1056/NEJMe068292. - DOI - PubMed
    1. Sotiriou C, Pusztai L. Gene-expression signatures in breast cancer. N Engl J Med. 2009;360(8):790–800. doi: 10.1056/NEJMra0801289. - DOI - PubMed
    1. van't Veer LJ, Dai H, van de Vijver MJ, He YD, Hart AAM, Mao M, Peterse HL, van der Kooy K, Marton MJ, Witteveen AT. et al.Gene expression profiling predicts clinical outcome of breast cancer. Nature. 2002;415(6871):530. - PubMed
    1. van de Vijver MJ, He YD, van't Veer LJ, Dai H, Hart AAM, Voskuil DW, Schreiber GJ, Peterse JL, Roberts C, Marton MJ. et al.A gene-expression signature as a predictor of survival in breast cancer. N Engl J Med. 2002;347(25):1999–2009. doi: 10.1056/NEJMoa021967. - DOI - PubMed
    1. Paik S, Shak S, Tang G, Kim C, Baker J, Cronin M, Baehner FL, Walker MG, Watson D, Park T. et al.A multigene assay to predict recurrence of tamoxifen-treated, node-negative breast cancer. N Engl J Med. 2004;351(27):2817–2826. doi: 10.1056/NEJMoa041588. - DOI - PubMed

Publication types