

FGF4-dependent stem cells derived from rat blastocysts differentiate along the trophoblast lineage
- PMID: 21215265
- PMCID: PMC3039089
- DOI: 10.1016/j.ydbio.2010.12.038
FGF4-dependent stem cells derived from rat blastocysts differentiate along the trophoblast lineage
Abstract
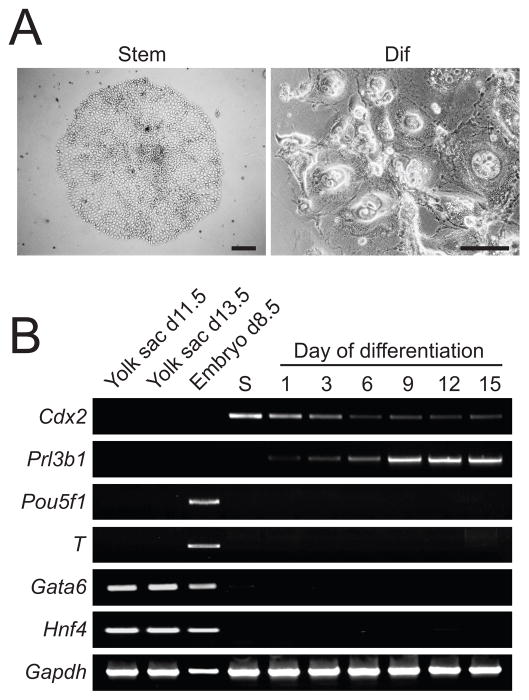
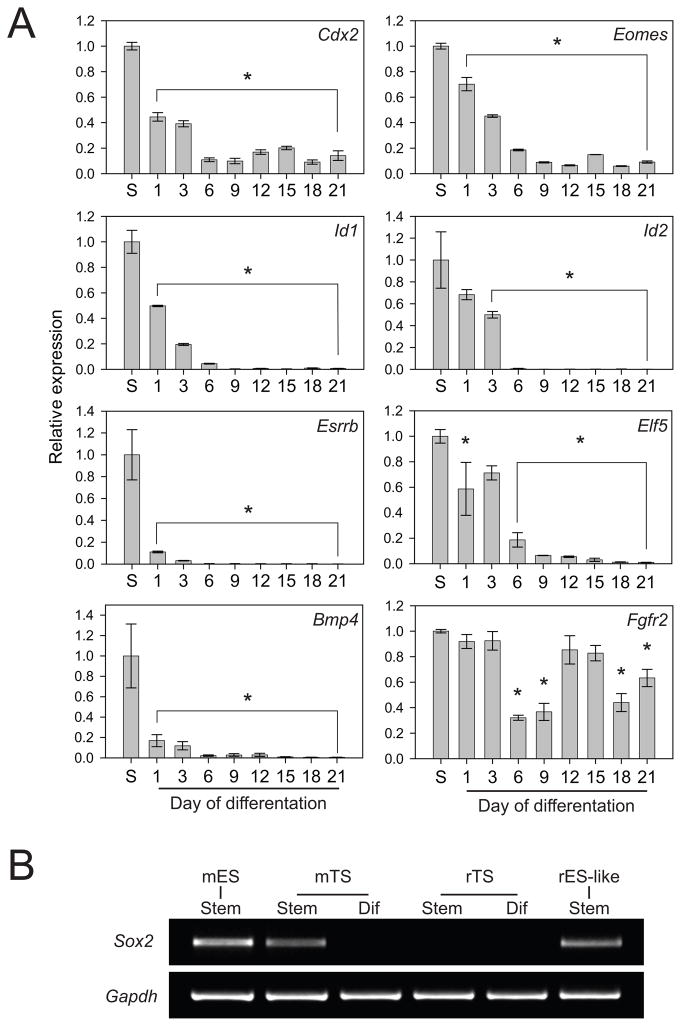
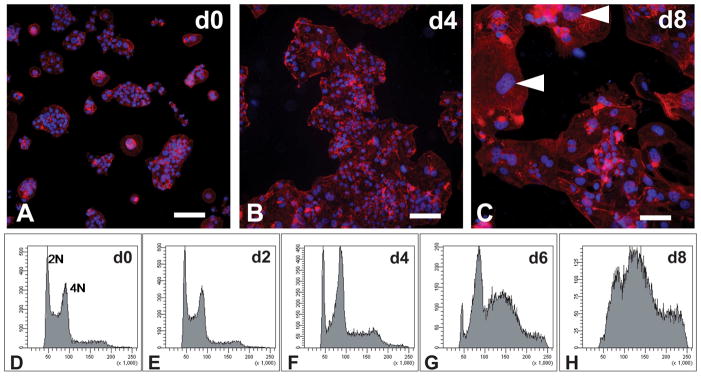
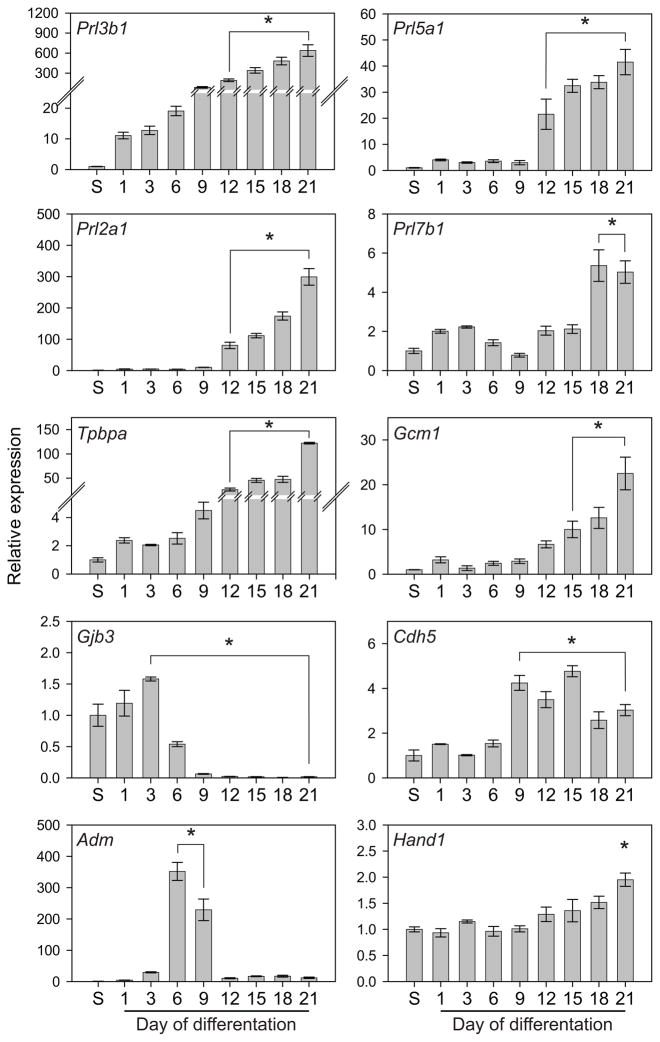
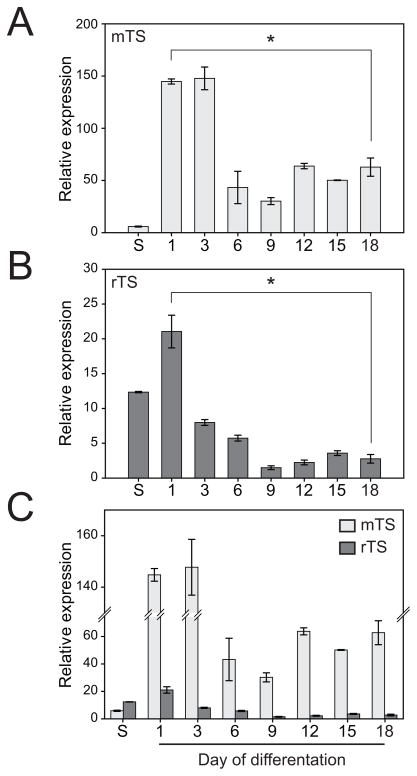
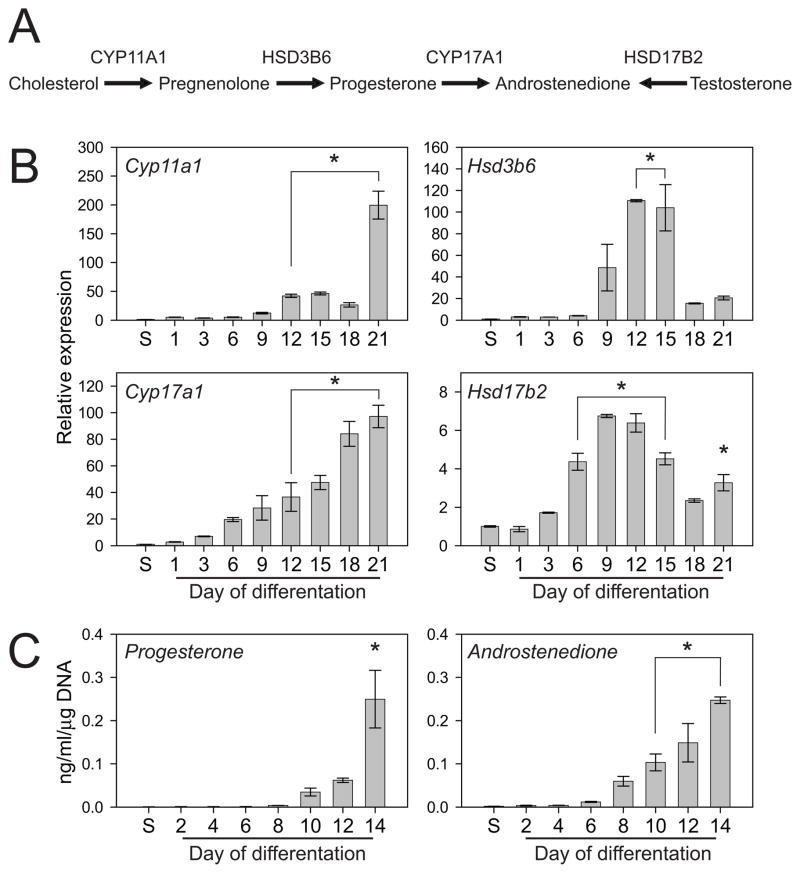
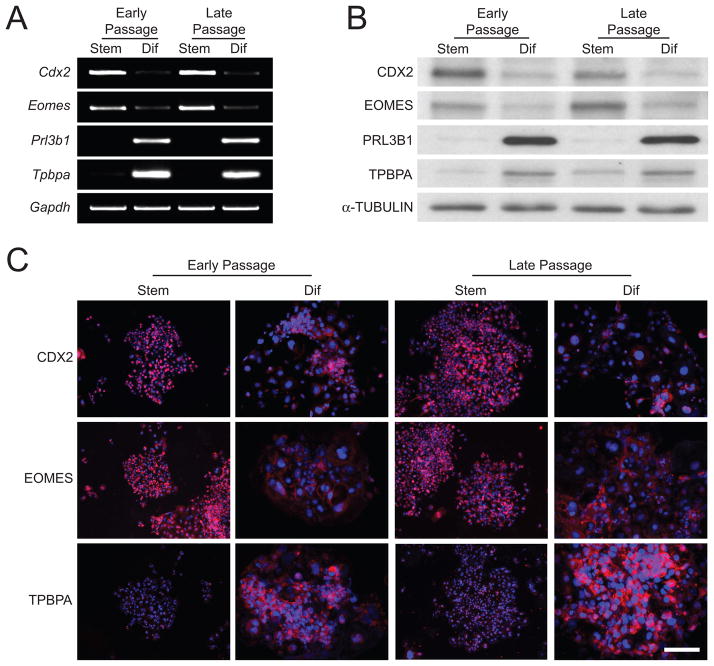
Differentiated trophoblast cell lineages arise from trophoblast stem (TS) cells. To date such a stem cell population has only been established in the mouse. The objective of this investigation was to establish TS cell populations from rat blastocysts. Blastocysts were cultured individually on a feeder layer of rat embryonic fibroblasts (REFs) in fibroblast growth factor-4 (FGF4) and heparin supplemented culture medium. Once cell colonies were established REF feeder layers could be replaced with REF conditioned medium. The blastocyst-derived cell lines, in either proliferative or differentiated states, did not express genes indicative of ICM-derived tissues. In the proliferative state the cells expressed established stem cell-associated markers of TS cells. Cells ceased proliferation and differentiated when FGF4, heparin, and REF conditioned medium were removed. Differentiation was characterized by a decline of stem cell-associated marker gene expression, the appearance of large polyploid cells (trophoblast giant cells), and the expression of trophoblast differentiation-associated genes. Collectively, the data indicate that the rat blastocyst-derived cell lines not only possess many features characteristic of mouse TS cells but also possess some distinct properties. These rat TS cell lines represent valuable new in vitro models for analyses of mechanisms controlling TS cell renewal and differentiation.
Copyright © 2010 Elsevier Inc. All rights reserved.
Figures
Similar articles
-
Promotion of trophoblast stem cell proliferation by FGF4.Science. 1998 Dec 11;282(5396):2072-5. doi: 10.1126/science.282.5396.2072. Science. 1998. PMID: 9851926
-
Simultaneous Derivation of Embryonic and Trophoblast Stem Cells from Mouse Blastocysts.Methods Mol Biol. 2020;2117:235-241. doi: 10.1007/978-1-0716-0301-7_14. Methods Mol Biol. 2020. PMID: 31960383
-
The Differentiation Potency of Trophoblast Stem Cells from Mouse Androgenetic Embryos.Stem Cells Dev. 2019 Feb 15;28(4):290-302. doi: 10.1089/scd.2018.0068. Epub 2019 Jan 14. Stem Cells Dev. 2019. PMID: 30526365
-
Trophoblast stem cells.Methods Enzymol. 2006;419:387-400. doi: 10.1016/S0076-6879(06)19015-1. Methods Enzymol. 2006. PMID: 17141063 Review.
-
Human trophoblast stem cells: Real or not real?Placenta. 2017 Dec;60 Suppl 1(Suppl 1):S57-S60. doi: 10.1016/j.placenta.2017.01.003. Epub 2017 Jan 5. Placenta. 2017. PMID: 28087122 Free PMC article. Review.
Cited by
-
SATB homeobox proteins regulate trophoblast stem cell renewal and differentiation.J Biol Chem. 2012 Jan 13;287(3):2257-68. doi: 10.1074/jbc.M111.287128. Epub 2011 Nov 28. J Biol Chem. 2012. PMID: 22123820 Free PMC article.
-
Intersection of regulatory pathways controlling hemostasis and hemochorial placentation.Proc Natl Acad Sci U S A. 2021 Dec 14;118(50):e2111267118. doi: 10.1073/pnas.2111267118. Proc Natl Acad Sci U S A. 2021. PMID: 34876522 Free PMC article.
-
NK cells, hypoxia and trophoblast cell differentiation.Cell Cycle. 2012 Jul 1;11(13):2427-30. doi: 10.4161/cc.20542. Epub 2012 Jul 1. Cell Cycle. 2012. PMID: 22659845 Free PMC article. Review.
-
HIF-KDM3A-MMP12 regulatory circuit ensures trophoblast plasticity and placental adaptations to hypoxia.Proc Natl Acad Sci U S A. 2016 Nov 15;113(46):E7212-E7221. doi: 10.1073/pnas.1612626113. Epub 2016 Nov 2. Proc Natl Acad Sci U S A. 2016. PMID: 27807143 Free PMC article.
-
Hypoxia and Placental Development.Birth Defects Res. 2017 Oct 16;109(17):1309-1329. doi: 10.1002/bdr2.1135. Birth Defects Res. 2017. PMID: 29105383 Free PMC article. Review.
References
-
- Ain R, Canham LN, Soares MJ. Gestational stage-dependent intrauterine trophoblast cell invasion in the rat and mouse: novel endocrine phenotype and regulation. Dev Biol. 2003;260:176–190. - PubMed
-
- Alam SMK, Ain R, Konno T, Ho-Chen JK, Soares MJ. The rat prolactin gene family locus: species-specific gene family expansion. Mammalian Genome. 2006;17:858–877. - PubMed
-
- An J, Beauchemin N, Albanese J, Abney TO, Sullivan AK. Use of a rat cDNA probe specific for the Y chromosome to detect male derived cells. J Androl. 1997;18:289–293. - PubMed
Publication types
MeSH terms
Substances
Grants and funding
LinkOut - more resources
Full Text Sources
Medical
