. 2011 Jan 7;144(1):92-105.
doi: 10.1016/j.cell.2010.11.049.

Dynamics between stem cells, niche, and progeny in the hair follicle

Affiliations

Dynamics between stem cells, niche, and progeny in the hair follicle

Ya-Chieh Hsu et al. Cell. .

Abstract

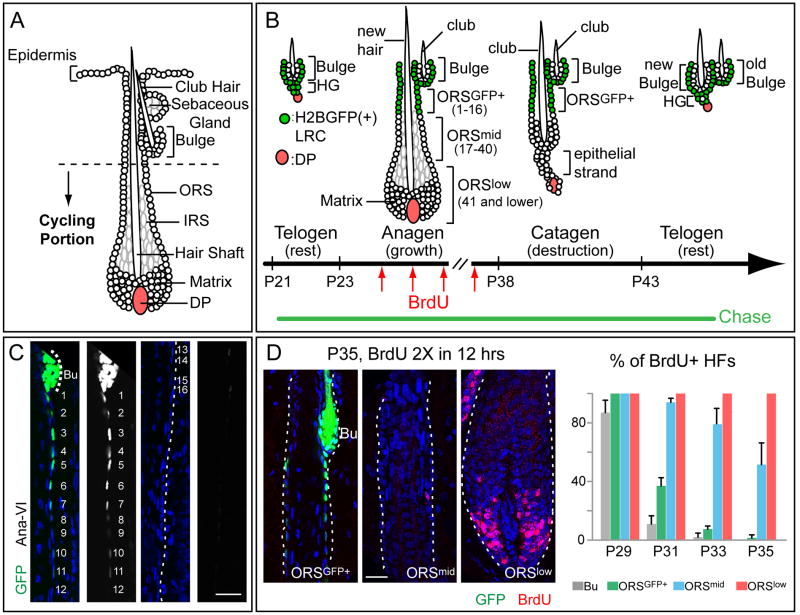
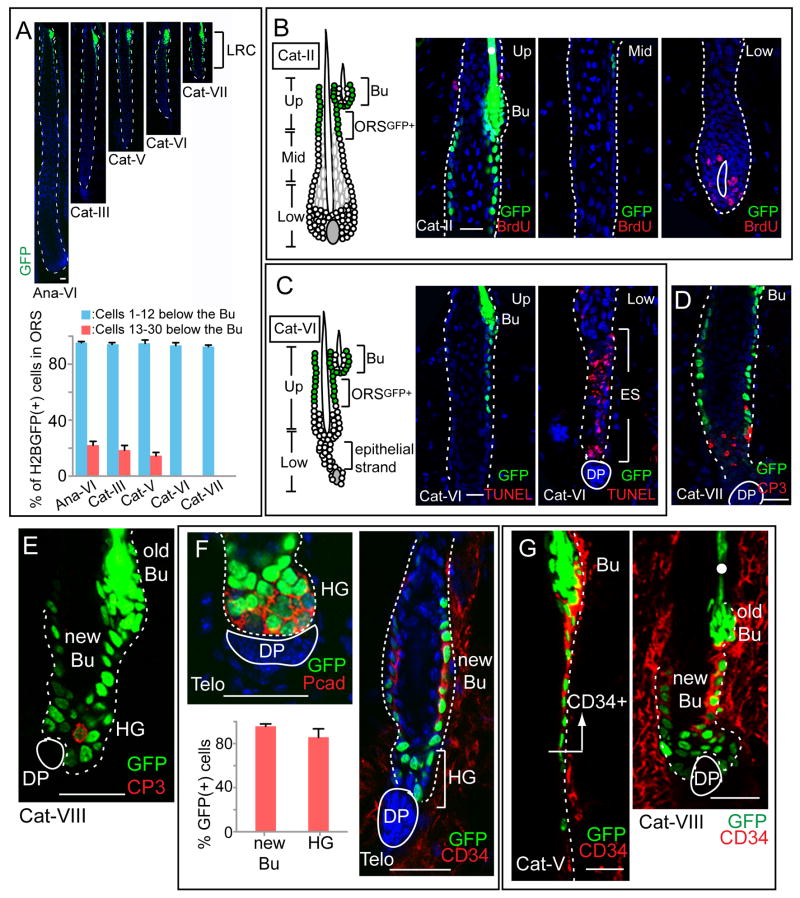
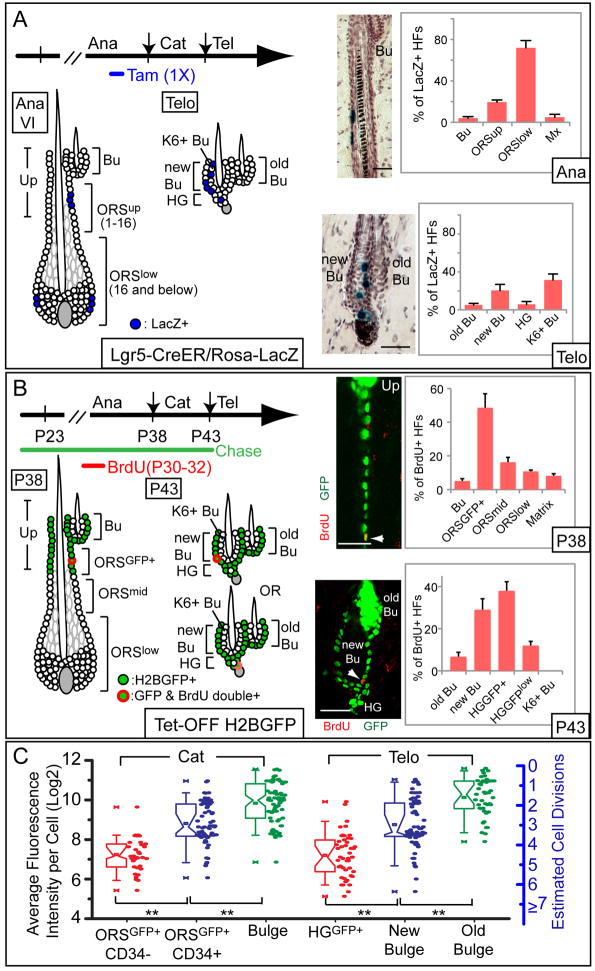
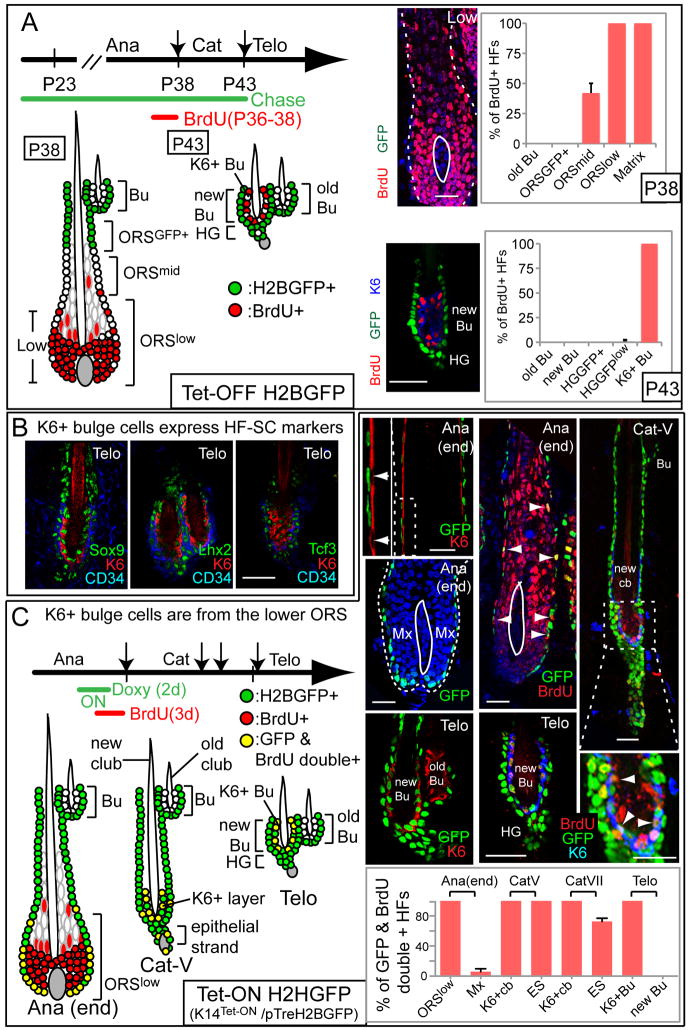
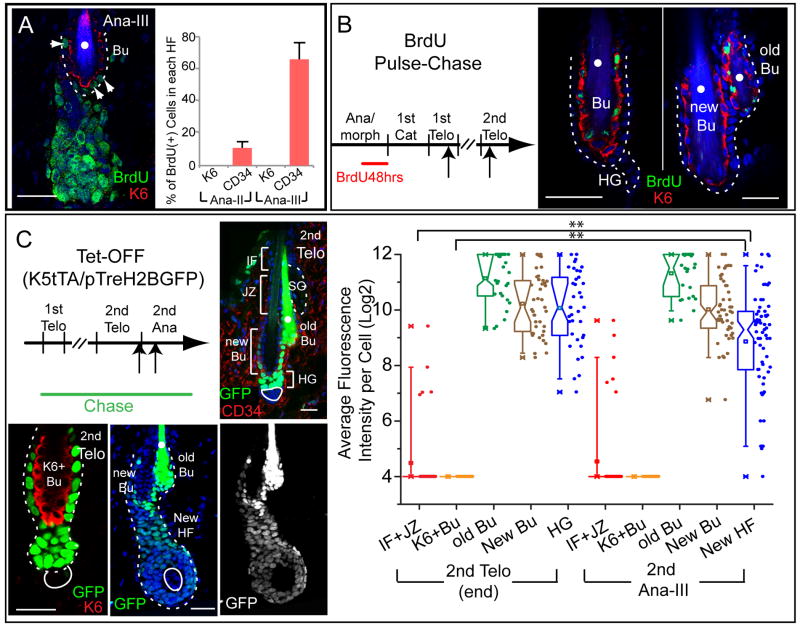
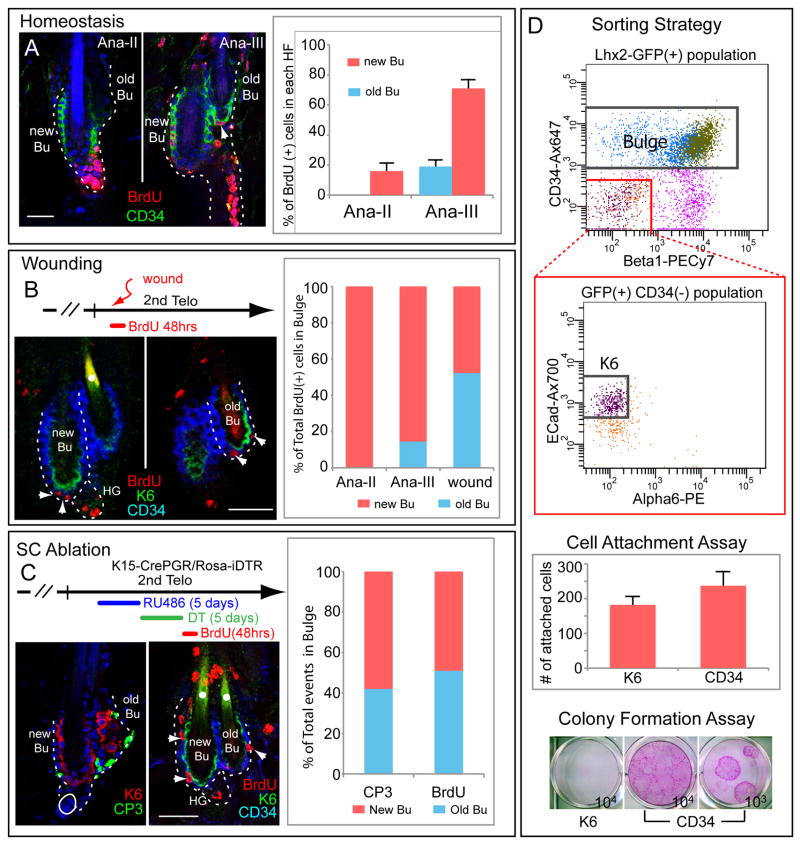
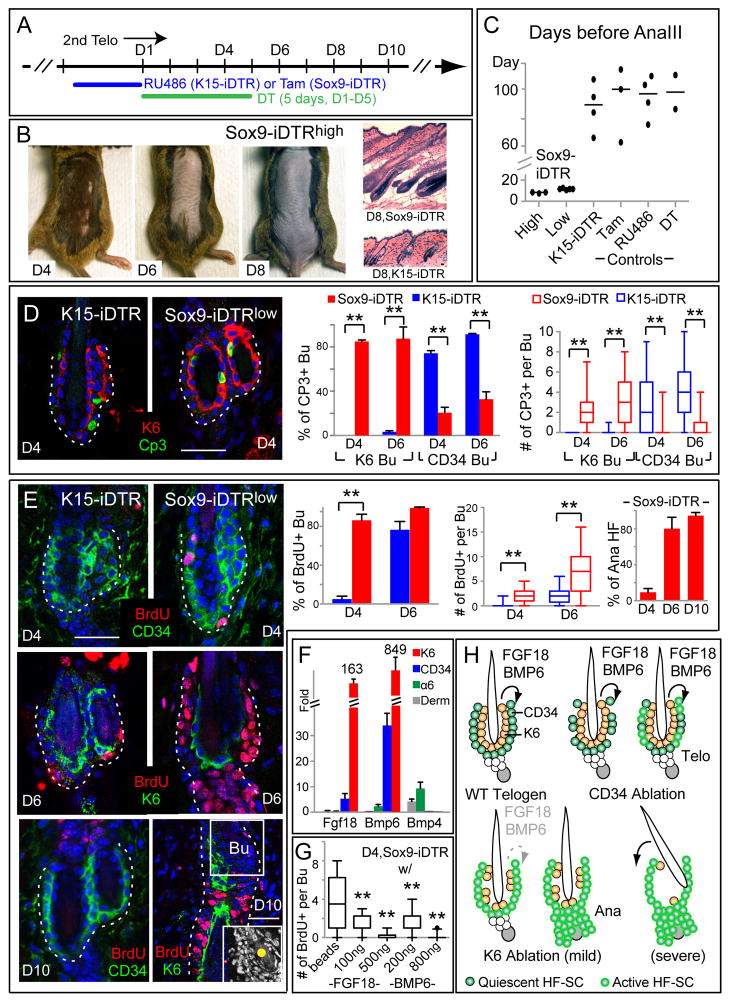
Here, we exploit the hair follicle to define the point at which stem cells (SCs) become irreversibly committed along a differentiation lineage. Employing histone and nucleotide double-pulse-chase and lineage tracing, we show that the early SC descendents en route to becoming transit-amplifying cells retain stemness and slow-cycling properties and home back to the bulge niche when hair growth stops. These become the primary SCs for the next hair cycle, whereas initial bulge SCs become reserves for injury. Proliferating descendents further en route irreversibly lose their stemness, although they retain many SC markers and survive, unlike their transit-amplifying progeny. Remarkably, these progeny also home back to the bulge. Combining purification and gene expression analysis with differential ablation and functional experiments, we define critical functions for these non-SC niche residents and unveil the intriguing concept that an irreversibly committed cell in an SC lineage can become an essential contributor to the niche microenvironment.


Figures

Figure 1
Figure 1. Dynamics of slow and fast cycling cells throughout the hair cycle
(A) Cycling portions of a mature HF (B-D) Tet-Off H2BGFP mice were chased from P21 to the days/stages noted (P35–P37 corresponds to AnaVI). Before harvesting skin, some mice were given 2X6 hr pulses of BrdU. Schematic depicts H2BGFP cells (green) that will be label-retaining (LRCs) when the chase is stopped at each stage. Cell #s are counting down from the bulge base (=0). In (C), the right panels are duplicates of GFP monochromes of the left panels. Scale bars, 30μm. Bu, bulge. DAPI in blue. Note that S-phase cells in AnaVI are mainly in ORSlow and matrix. %HFs with BrdU+ cells in bulge or in different ORS segments were quantified from P29–P35. For each stage, n=2 mice and ≥23 HFs/mouse were counted. Data are mean ± SD.
Figure 2
Figure 2. Label-retaining HF-SC descendents in the ORS are spared from apoptosis during catagen and form a new bulge and HG at telogen
Tet-Off H2BGFP mice were chased from P21 to the HF stages indicated. Prior to analysis, some mice were given a 4hr BrdU pulse. (A) H2BGFP LRCs maintain the same distribution from anagen VI to catagen’s end. (B) BrdU labeling in early catagen (Cat-II) shows proliferation only in matrix and ORSlow and not ORSGFP+ or ORSmid. (C-E) TUNEL and CP3 immunolabeling in catagen VI–VIII reveals cell death in the retracting epithelial strand (ES) but rarely in LRCs. (F) Fate of H2BGFP LRCs at catagen to 2nd telogen transition. Like the old bulge, the emerging new bulge and HG contain LRCs. Quantifications: n=3 mice; 42 total HFs analyzed for bulge; 87 for HG. (G) HF-SC bulge marker CD34 is upregulated in upper ORSGFP+ beginning at catagen V. The shape of the future new bulge and HG can already be distinguished at Cat-VIII. HFs are outlined by dotted white line. White dots mark autofluorescent hair shafts. Scale bars, 30μm. Data are mean ± SD.
Figure 3
Figure 3. ORSGFP+ LRCs form the HG and CD34+ SCs of the new bulge
Schematics summarize experiments and results. (A) Lineage tracing with Lgr5CreER/Rosa-LacZ to monitor ORS cell fate. Tamoxifen was given in full-anagen. 3d later (AnaVI), most HFs had LacZ+ cells in ORS (both up and low), but not bulge or matrix. When chased to telogen, LacZ+ cells showed up mainly in new bulge (both CD34+ and K6+ layers). n=2 mice, 176 HFs. Quantifications were on 90μm sections; images shown are 20μm sections (hematoxylin counterstain). (B) H2BGFP/BrdU double-label, double-pulse-chase experiment to monitor fate of upper ORSGFP cells. Tet-Off H2BGFP mice were chased from P21 and BrdU pulses during mid-anagen (P30–32) preferentially labeled cells in the upper ORSGFP trail. When chased to the anagen/catagen transition (P38), many HFs had BrdU+ LRCs in their ORSGFP+ (arrowhead); BrdU+ LRCs were rare elsewhere (n=3 mice, 42 HFs). When chased to telogen (P43), BrdU+/GFP+ cells (arrowhead) were mainly in the new bulge or HG (n=3 mice, 58 HFs). Scale bars, 30μm. new Bu and K6+Bu denote CD34+ and K6+ layers of new bulge. (C) Relative epifluorescence intensities of cells from different LRC populations of Tet-Off H2BGFP mice chased from the 1st telogen through one hair cycle. Raw data sets are plotted to right of each box-and-whisker diagram: median, 25th and 75th percentiles are denoted by notch, bottom and top boxes; 5th and 95th percentile are whiskers; minimum and maximum measurements are x’s. Asterisks indicate significant differences between data sets (**: P<0.01). Data are mean ± SD.
Figure 4
Figure 4. K6+ bulge cells express HF-SC markers and are derived from actively cycling lower ORS during catagen
(A) H2BGFP/BrdU double-label, double pulse-chase scheme to monitor fate of cells below the mid-zone ORS. BrdU was administered to Tet-Off H2BGFP mice at anagen’s end (P36–38) and analyzed directly, or after chasing to telogen. At P38, many lower ORS and matrix cells are BrdU+ (n=2 mice, 38 HFs). When chased to P43, BrdU+ LRCs are restricted to the K6+ layer of the new bulge (n=4 mice, 129 HFs). (B) K6+ bulge cells express key transcription factors characteristic of bulge SCs and their ORS progeny. (C) Lineage tracing with K14Tet-On/H2BGFP coupled with BrdU pulse-chase. Doxy was administered to turn on H2BGFP in the entire ORS, but not K6+ companion layer or matrix, in late anagen. From catagen V through telogen, H2BGFP is detected in K6+ cells at the tip of the newly formed club hair. This layer retracts with the club hair during catagen and winds up in the new bulge by telogen. Note that K6+ old bulge cells are not GFP+. If BrdU is given at anagen’s end, BrdU+/H2BGFP+ cells are found in ORSlow. At catagen, double+ cells are in K6+ layer, which by telogen has moved inside new bulge. Scale bars, 30μm. K6+ club=K6+ layer enclosing new club hair. new Bu and K6+Bu denote CD34+ and K6+ layers of new bulge (n=2 mice; >23 HFs per stage). Data are mean ± SD.
Figure 5
Figure 5. CD34+ bulge SCs and HG are the only cells used in normal HF homeostasis
(A) Representative example and quantifications of HFs in early anagen (AnaII-AnaIII) with 2d BrdU pulse. Note BrdU in some CD34+ HF-SCs (arrowheads) but not inner K6+ bulge cells. White dots denote autofluorescent club hair (n=2 mice, 61 HFs for AnaII; n=3 mice, 133 HFs for AnaIII). (B) A 2d BrdU pulse given at anagen’s end is followed through 2 hair cycles. While not proliferative, K6+ bulge cells retain label from late anagen predecessors. K6+/BrdU+ cells persist through the next hair cycle and become the K6 layer of old bulge. (C) Lineage tracing using Tet-Off H2BGFP mice shows that the new HF comes from bulge LRCs. Chase was begun at 1st telogen; analysis began at end of 2nd telogen when H2BGFP selectively label old, new bulge and HG. Developing HFs are composed solely of H2BGFP+ cells. IF, infundibulum; JZ, junctional zone; SG, sebaceous gland. Scale bars, 30μm. Box-and-whisker plots measure H2BGFP epifluorescence intensity within different HF populations. Note paucity of GFP intensity in IF, JZ and K6+ bulge, revealing their lack of contribution to (GFP+) newly forming HF. **: P<0.01. Data are mean ± SD.
Figure 6
Figure 6. CD34+ but not K6+ bulge cells are activated in wound repair and upon HF-SC ablation
(A) Homeostasis. Mice given a 2d pulse with BrdU at start of 2nd anagen were monitored to AnaIII. Arrowhead marks BrdU+ cell in old bulge, which is >3X less active than new bulge (n=3 mice, 62 HFs). (B) Wounding. Punch biopsies were from 2nd telogen. BrdU given over 2d shows that old and new bulges participate comparably in injury responses (n=3 mice, 31 HFs). (C) SC ablation. K15-CrePGR was used to express DTR in CD34+ bulge during 2nd telogen. After DT and BrdU, mice were analyzed (n=3 mice, 64 HFs). Note that when bulge SCs are ablated, remaining CD34+ cells from old and new bulges proliferate, while K6+ bulge cells are refractory. Scale bars, 30μm. (D) K6+ and CD34+ bulge cells were isolated by FACS from telogen HFs of Lhx2-EGFP mice and subjected to culture experiments, performed in triplicate. 1000 cells of each population were assayed for attachment 16hr post-plating. K6+ and CD34+ cells were also plated and a/ 3 wks, colonies were fixed and stained w/1% Rhodamine B. Data are mean ± SD.
Figure 7
Figure 7. K6+ bulge cells anchor the club hair and serve as a signaling center for the HF-SC niche
(A) Scheme to differentially express DTR in K6+ and CD34+ bulge cells and selectively DT-ablate each layer during extended 2nd telogen. D1=d1 of DT injection. Sox9-iDTRhigh was treated with Tamoxifen 4d while Sox9-iDTRlow was treated 2d (see text). (B) In contrast to K15-iDTR mice, Sox9-iDTR mice lose their hair coat at D6 (anchoring function) and skin turns black at D8, reflective of precocious entry into anagen and confirmed by histology. (C) Quantifications of anagen entry (signaling function). Graph shows #d before HFs entered anagen III for various genotypes/treatments. Horizontal bars denote median. (D, E) DT-treated K15- and Sox9-iDTR mice were given a 1d BrdU pulse at times indicated prior to immunodetection of apoptotic and proliferation markers on skin sections. In D10 Sox9-iDTR image, K6 marks the anagen companion layer. Scale bars, 30μm. Graphs quantify %bulges positive for CP3, BrdU and anagen. Box-and-whisker plots indicate #events per HF/bulge: mid-line, median; box, 25th to 75th percentiles; whiskers, minimum and maximum. (F) Real-time PCR on FACS-isolated populations. Values are normalized to total skin (epidermis+dermis) mRNAs. Bmp4 is higher in dermis (derm) and α6+ cells as previously reported (Plikus et al., 2008). Note high Fgf18 and Bmp6 expression in K6+ bulge cells. (G) Sox9-iDTR mice were treated 3d w/DT and growth factors and then 1d w/BrdU before analysis of proliferation (>24 HFs/experiment in duplicate). (H) Model summarizes different outcomes of ablating K6+ vs CD34+ bulge cells in telogen. When CD34+ cells are ablated, remaining HF-SCs become activated briefly, but then return to quiescence. When K6+ cells are ablated, quiescent signals (FGF18, BMP6) from K6+ bulge are lost, greatly reducing the threshold for anagen-activation. The K6+ bulge layer also functions to anchor the club hair. **: P<0.01. Data are mean ± SD.

Comment in

References

    1. Barker N, van Es JH, Kuipers J, Kujala P, van den Born M, Cozijnsen M, Haegebarth A, Korving J, Begthel H, Peters PJ, Clevers H. Identification of stem cells in small intestine and colon by marker gene Lgr5. Nature. 2007;449:1003–1007. - PubMed
    1. Blanpain C, Lowry WE, Geoghegan A, Polak L, Fuchs E. Self-renewal, multipotency, and the existence of two cell populations within an epithelial stem cell niche. Cell. 2004;118:635–648. - PubMed
    1. Brawley C, Matunis E. Regeneration of male germline stem cells by spermatogonial dedifferentiation in vivo. Science. 2004;304:1331–1334. - PubMed
    1. Buch T, Heppner FL, Tertilt C, Heinen TJ, Kremer M, Wunderlich FT, Jung S, Waisman A. A Cre-inducible diphtheria toxin receptor mediates cell lineage ablation after toxin administration. Nat Methods. 2005;2:419–426. - PubMed
    1. Cao YA, Wagers AJ, Beilhack A, Dusich J, Bachmann MH, Negrin RS, Weissman IL, Contag CH. Shifting foci of hematopoiesis during reconstitution from single stem cells. Proc Natl Acad Sci U S A. 2004;101:221–226. - PMC - PubMed

Publication types