

Hypothalamic neurosphere progenitor cells in low birth-weight rat newborns: neurotrophic effects of leptin and insulin
- PMID: 21215735
- PMCID: PMC3472808
- DOI: 10.1016/j.brainres.2010.12.080
Hypothalamic neurosphere progenitor cells in low birth-weight rat newborns: neurotrophic effects of leptin and insulin
Abstract
A low birth-weight (LBW) offspring exhibits reduced hypothalamic neural satiety pathways and dysregulated signaling leading to programmed hyperphagia and adult obesity. Hypothalamic appetite circuits develop during early life, under the influence of neurotrophic hormones (leptin and insulin). Notably, LBW newborns have reduced plasma leptin and insulin levels. As neurons and glia arise from neuronal progenitor cells (NPC), we postulated that a programmed impairment of NPCs may contribute to reduced hypothalamic neural pathway development in a LBW offspring. Control dams received ad libitum food, whereas study dams were 50% food-restricted from pregnancy day 10 to 21 (LBW). At day 1 of age, hypothalamic NPCs were cultured as neurospheres (NS) and treated with leptin/insulin. We analyzed in vitro NPC proliferation and differentiation into neurons/astrocytes, expression of signal molecules promoting proliferation (activated Notch1 and its downstream target, Hes1) and in vivo NPC proliferation and migration. LBW offspring had impaired in vivo evidence of NPC division and migration, and reduced in vitro evidence of proliferation and differentiation to neurons and astrocytes, under basal and stimulated conditions. The reduced Notch1 and Hes1 expression in LBW neurosphere, under both basal and stimulated conditions, suggests a reduced progenitor cell population or reduced cell density within the neurosphere.
Copyright © 2011 Elsevier B.V. All rights reserved.
Figures
 ) and LBW (
 ) newborn males. The images (×20) show hypothalamic BrdU (cell proliferation) and DAPI (nuclear marker) immunostaining around third venticular (V) region. C: In Vivo NPC Proliferation and Migration Food-restricted (n=3) and control (n=3) pregnant dams were injected with BrdU (50 mg/kg/day, i.p.) from e17–e19. After birth, brains were collected from 1 day old Control () and LBW () newborn males. Three brains per litter were frozen, and three sections per brain were immunostained. Cell proliferation was determined by counting BrdU positive cells in third ventricle and midline. Migration rate was determined by counting BrdU labeled cells in the area between 30 µm to 100 µm from midline. The average of BrdU-labeled cell numbers of three sections represented one brain and average of three brain cell numbers represented one litter. Values are mean±SE; *P<0.05 vs. Control.
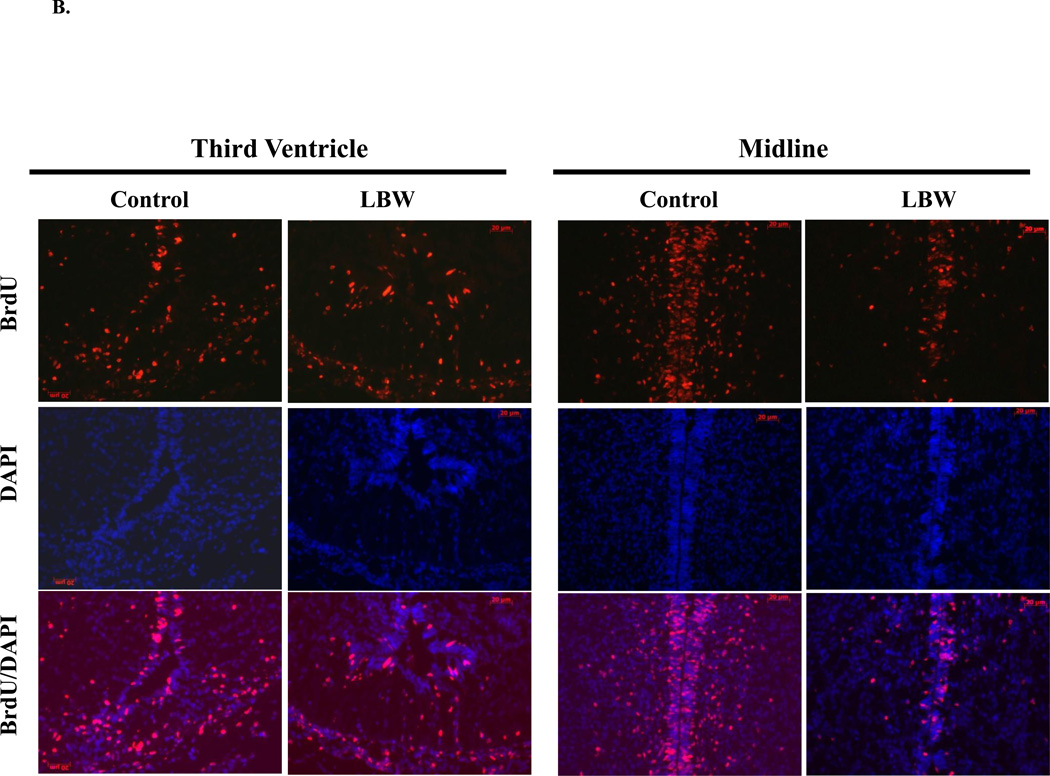 ) and LBW () newborn males. The images (×20) show hypothalamic BrdU (cell proliferation) and DAPI (nuclear marker) immunostaining around third venticular (V) region. C: In Vivo NPC Proliferation and Migration Food-restricted (n=3) and control (n=3) pregnant dams were injected with BrdU (50 mg/kg/day, i.p.) from e17–e19. After birth, brains were collected from 1 day old Control () and LBW () newborn males. Three brains per litter were frozen, and three sections per brain were immunostained. Cell proliferation was determined by counting BrdU positive cells in third ventricle and midline. Migration rate was determined by counting BrdU labeled cells in the area between 30 µm to 100 µm from midline. The average of BrdU-labeled cell numbers of three sections represented one brain and average of three brain cell numbers represented one litter. Values are mean±SE; *P<0.05 vs. Control.
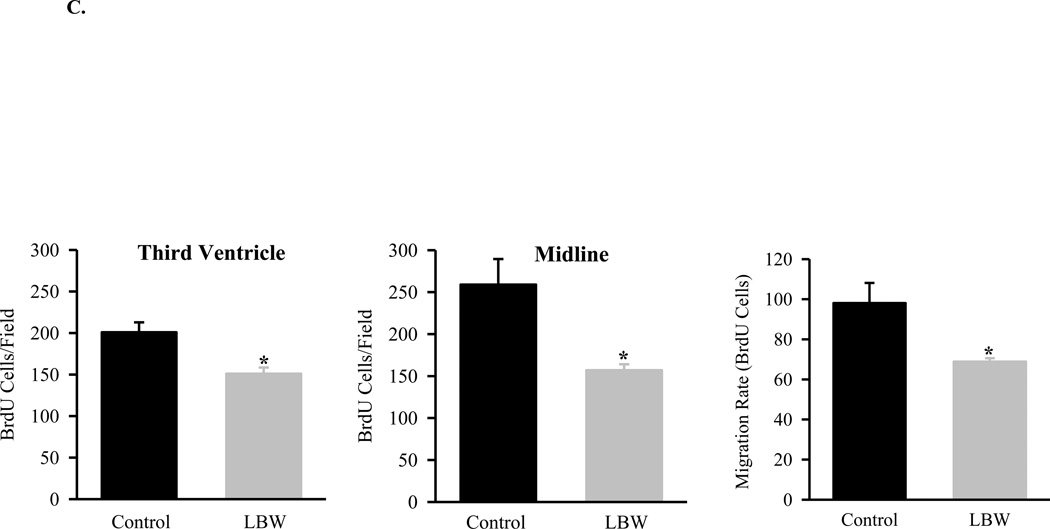 ) and LBW () newborn males. The images (×20) show hypothalamic BrdU (cell proliferation) and DAPI (nuclear marker) immunostaining around third venticular (V) region. C: In Vivo NPC Proliferation and Migration Food-restricted (n=3) and control (n=3) pregnant dams were injected with BrdU (50 mg/kg/day, i.p.) from e17–e19. After birth, brains were collected from 1 day old Control () and LBW () newborn males. Three brains per litter were frozen, and three sections per brain were immunostained. Cell proliferation was determined by counting BrdU positive cells in third ventricle and midline. Migration rate was determined by counting BrdU labeled cells in the area between 30 µm to 100 µm from midline. The average of BrdU-labeled cell numbers of three sections represented one brain and average of three brain cell numbers represented one litter. Values are mean±SE; *P<0.05 vs. Control.
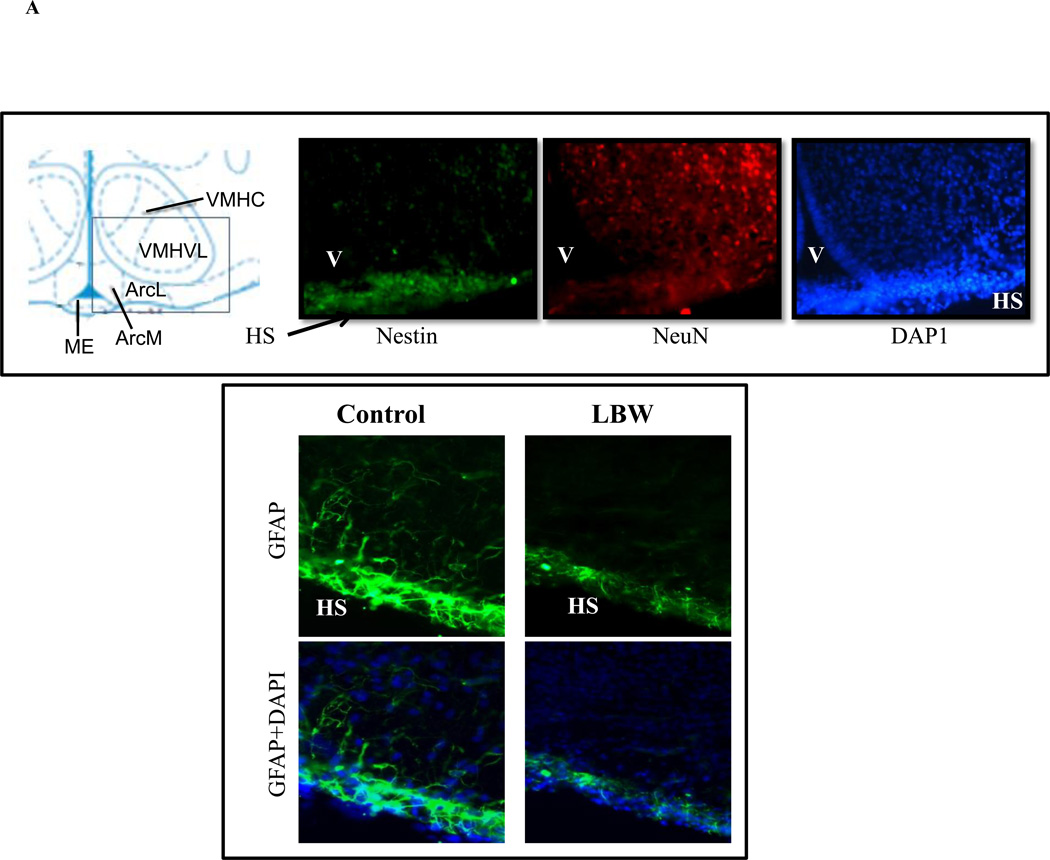
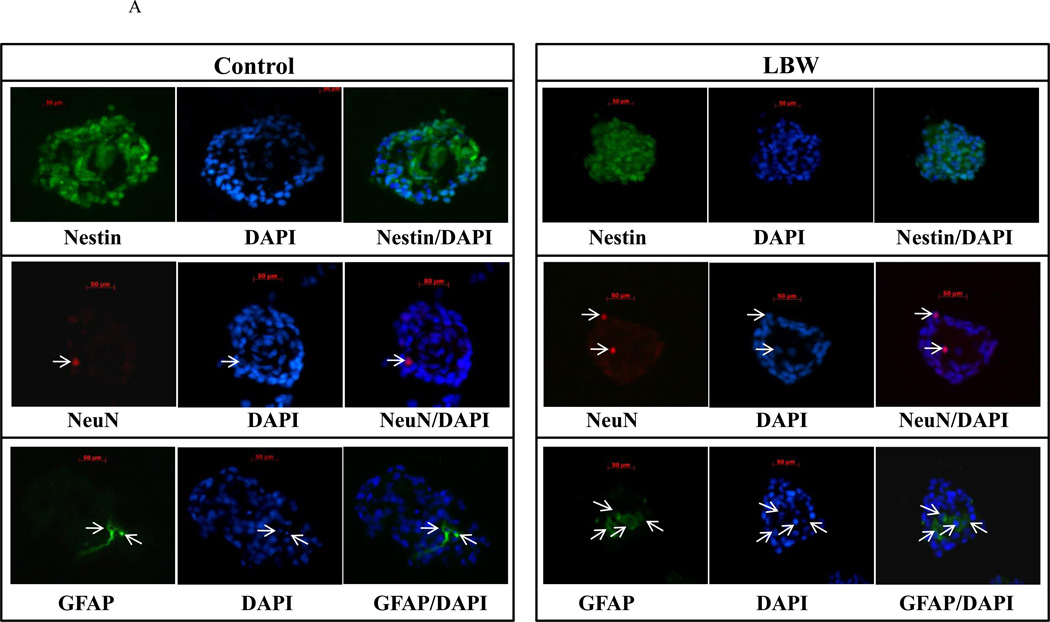 ) and LBW () newborn males were cultured in complete media. Neurospheres were sectioned (5 µm) and immunostained with nestin, Neu and GFAP. Images of LBW and Control are shown at 40× magnification. B: Basal Hypothalamic NPC Proliferation Hypothalamic NPC from 1 day old Control () and LBW () newborn males were cultured in complete media. Live images (magnification ×20), basal cell proliferation rate and nestin protein expression of LBW and Control NPCs. Values are fold change (mean ± SE); * P < 0.05 LBW vs. Control. C: Basal Hypothalamic NPC Differentiation Hypothalamic NPC from 1 Control () and LBW () newborn males were cultured in
 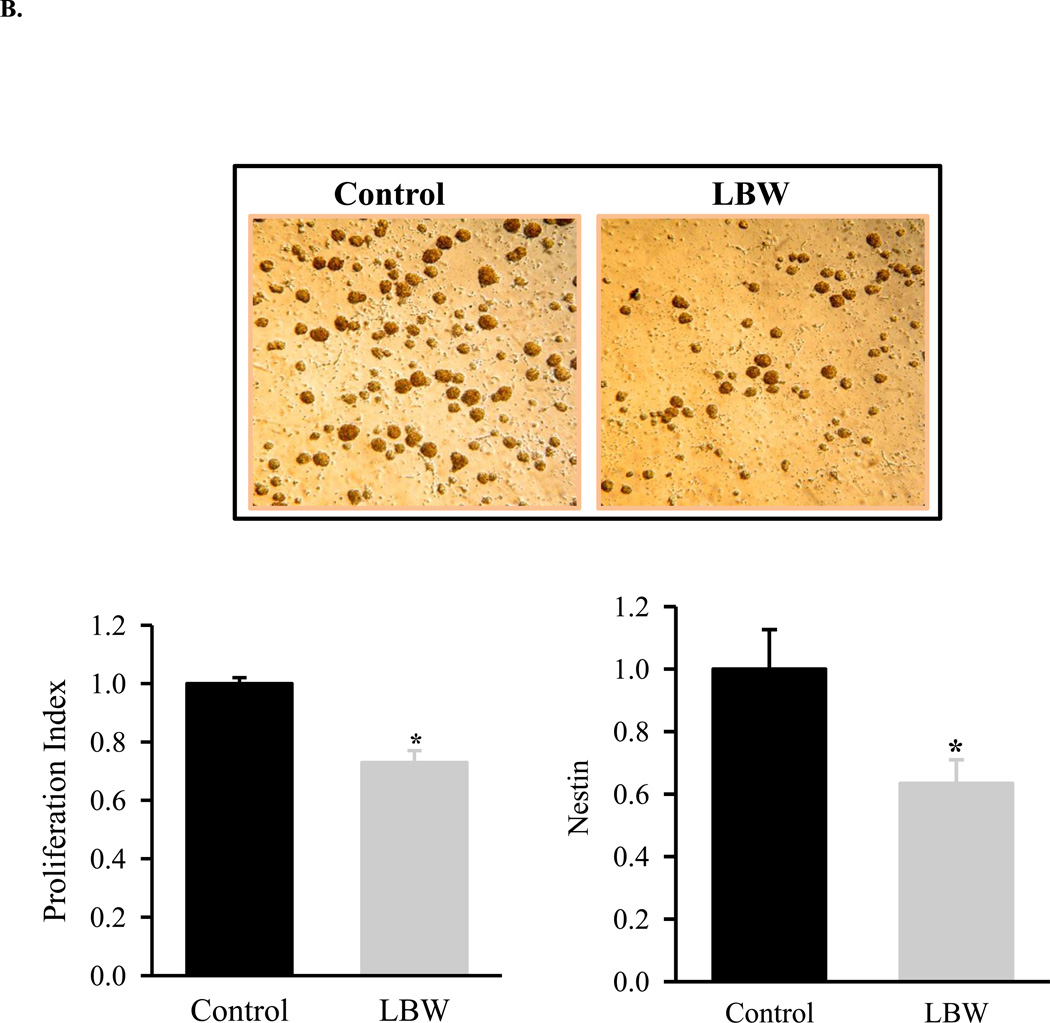 ) and LBW () newborn males were cultured in complete media. Neurospheres were sectioned (5 µm) and immunostained with nestin, Neu and GFAP. Images of LBW and Control are shown at 40× magnification. B: Basal Hypothalamic NPC Proliferation Hypothalamic NPC from 1 day old Control () and LBW () newborn males were cultured in complete media. Live images (magnification ×20), basal cell proliferation rate and nestin protein expression of LBW and Control NPCs. Values are fold change (mean ± SE); * P < 0.05 LBW vs. Control. C: Basal Hypothalamic NPC Differentiation Hypothalamic NPC from 1 Control () and LBW () newborn males were cultured in
 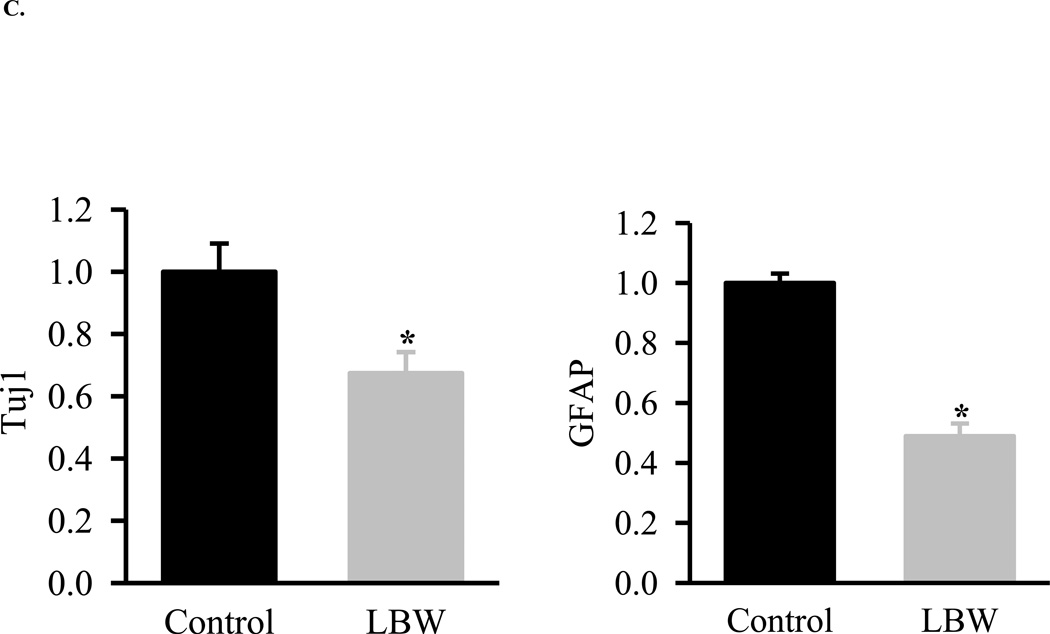 ) and LBW () newborn males were cultured in complete media. Neurospheres were sectioned (5 µm) and immunostained with nestin, Neu and GFAP. Images of LBW and Control are shown at 40× magnification. B: Basal Hypothalamic NPC Proliferation Hypothalamic NPC from 1 day old Control () and LBW () newborn males were cultured in complete media. Live images (magnification ×20), basal cell proliferation rate and nestin protein expression of LBW and Control NPCs. Values are fold change (mean ± SE); * P < 0.05 LBW vs. Control. C: Basal Hypothalamic NPC Differentiation Hypothalamic NPC from 1 Control () and LBW () newborn males were cultured in
  ) and LBW () males were cultured in ) and LBW () males were cultured in
  ) and LBW () males were cultured in ) and LBW () males were cultured in
 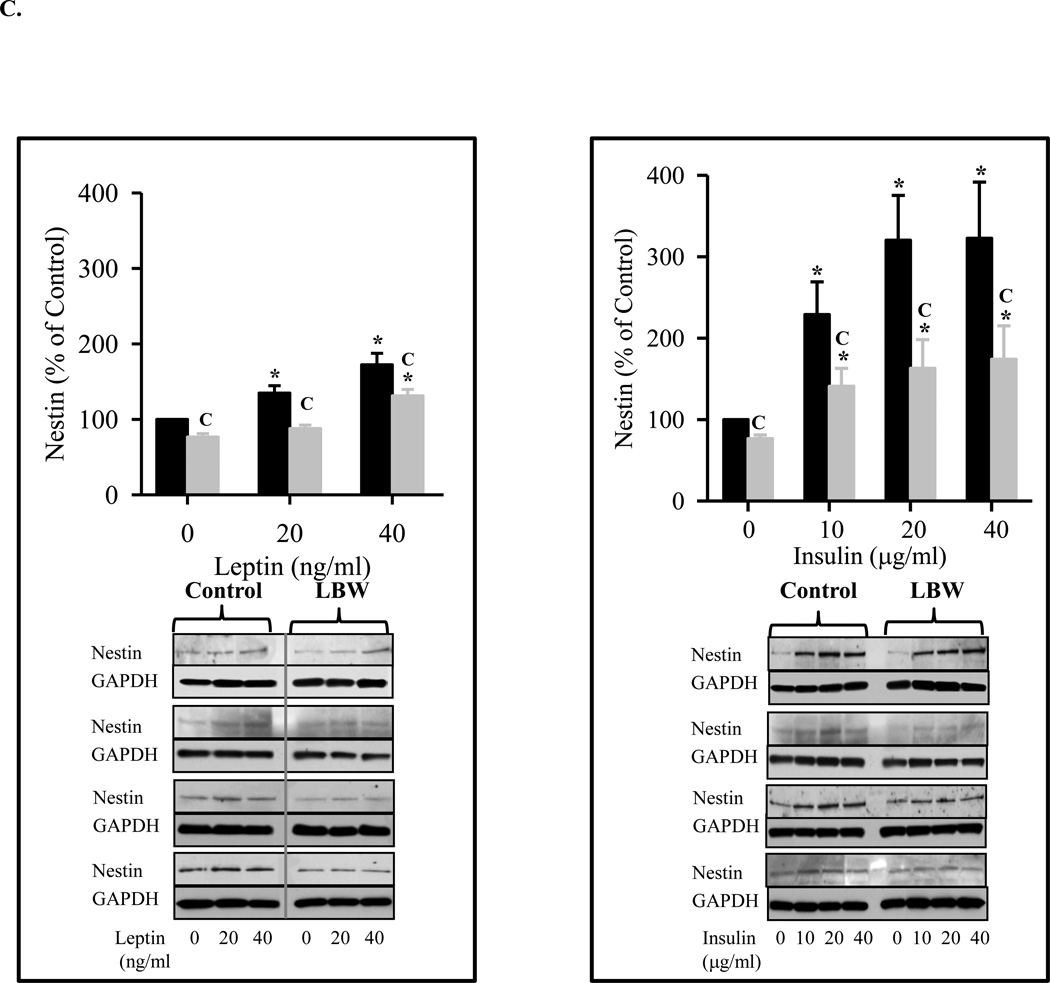 ) and LBW () males were cultured in ) and LBW () males were cultured in
 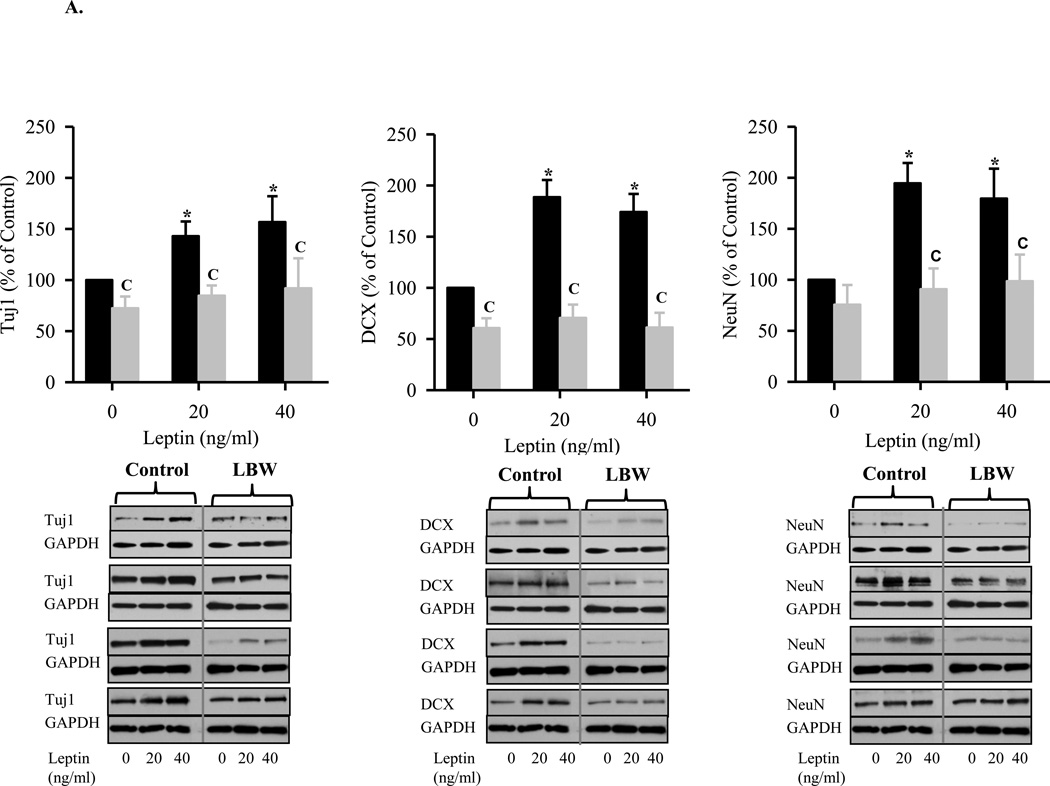 ) and LBW () males were cultured in ) and LBW () males were cultured in ) and LBW () males were cultured in
 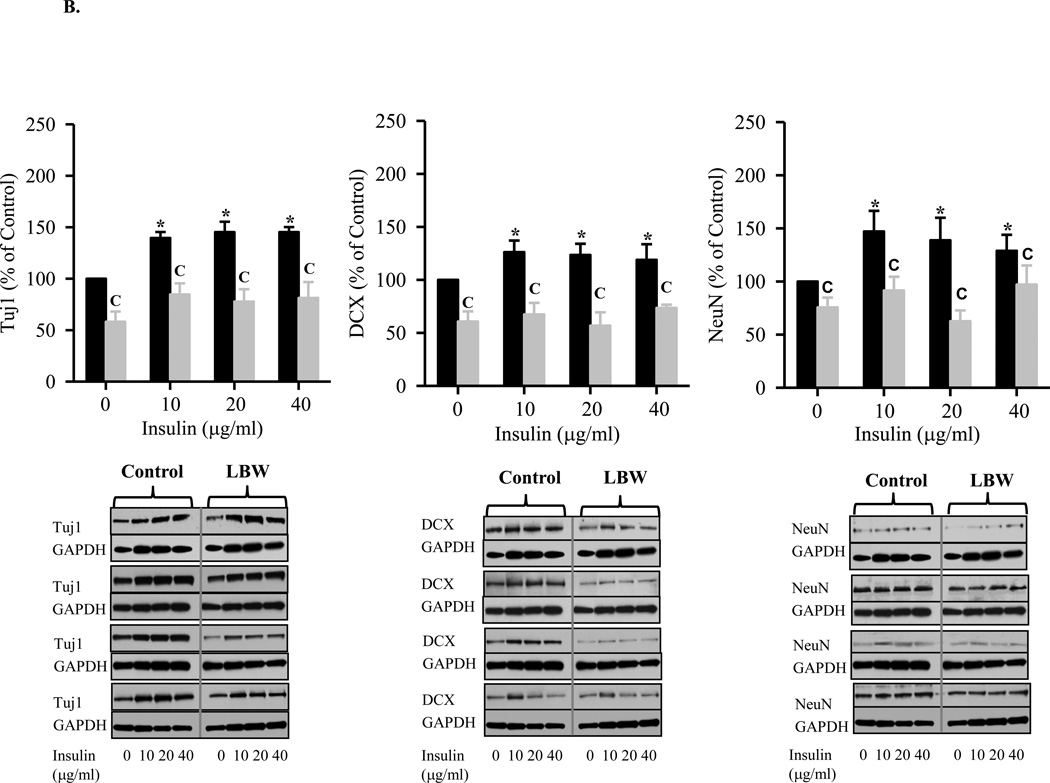 ) and LBW () males were cultured in ) and LBW () males were cultured in ) and LBW () males were cultured in
 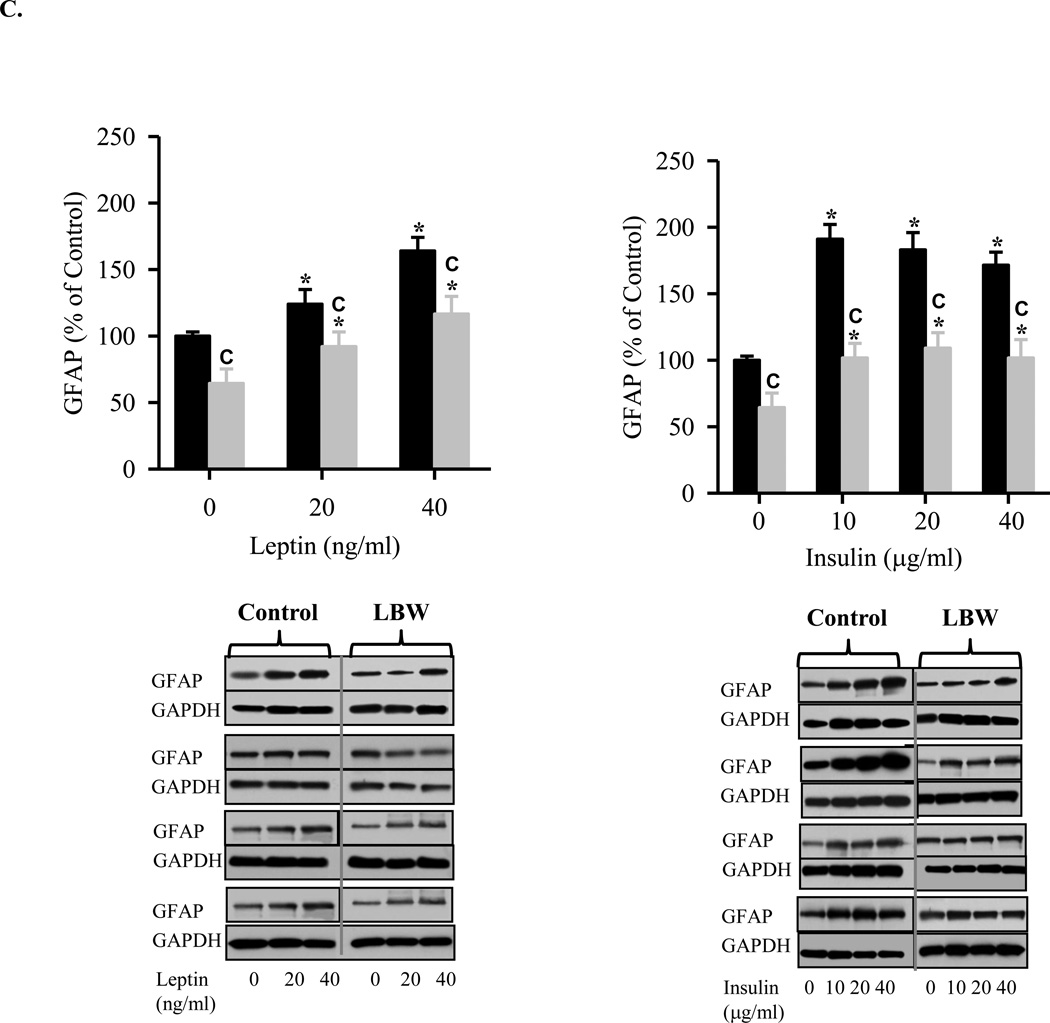 ) and LBW () males were cultured in ) and LBW () males were cultured in ) and LBW () males were cultured in
 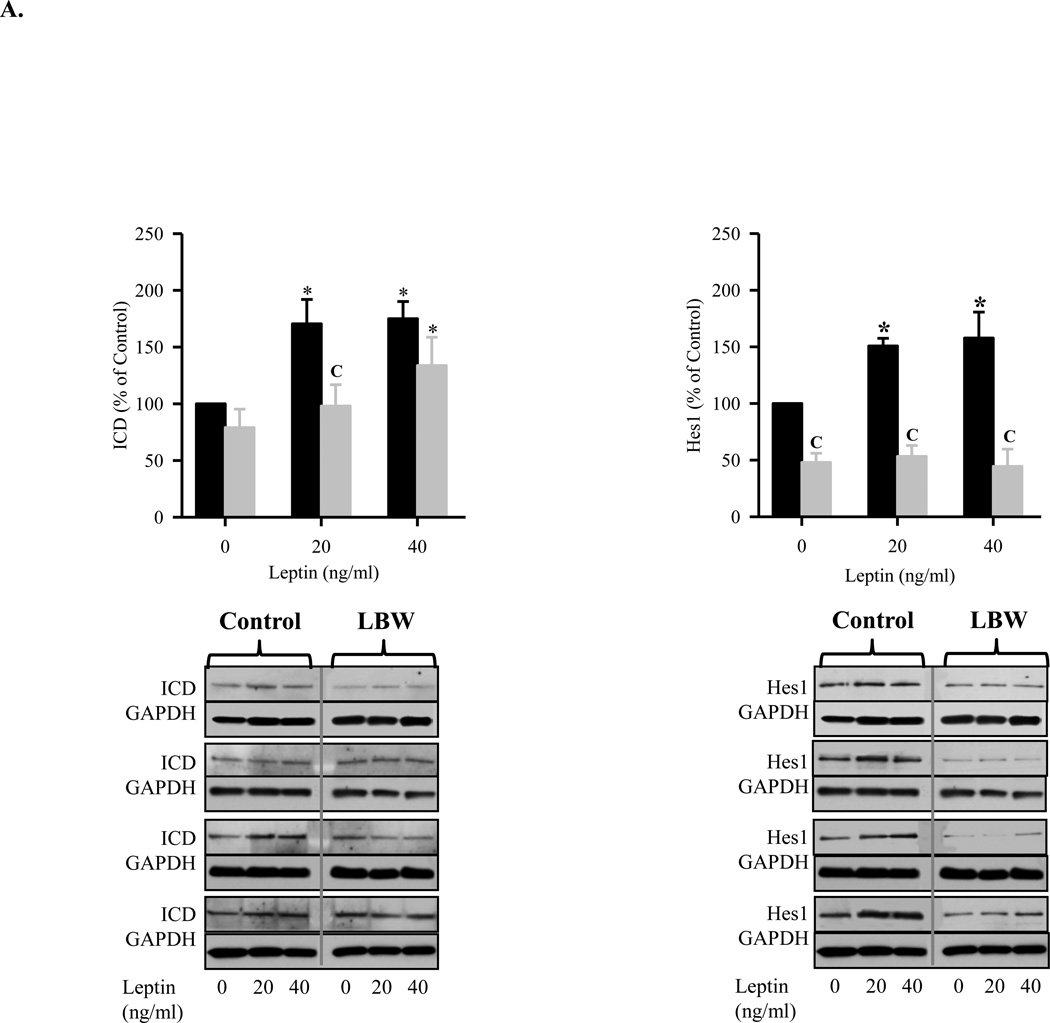 ) and LBW () males were cultured in ) and LBW () males were cultured in
 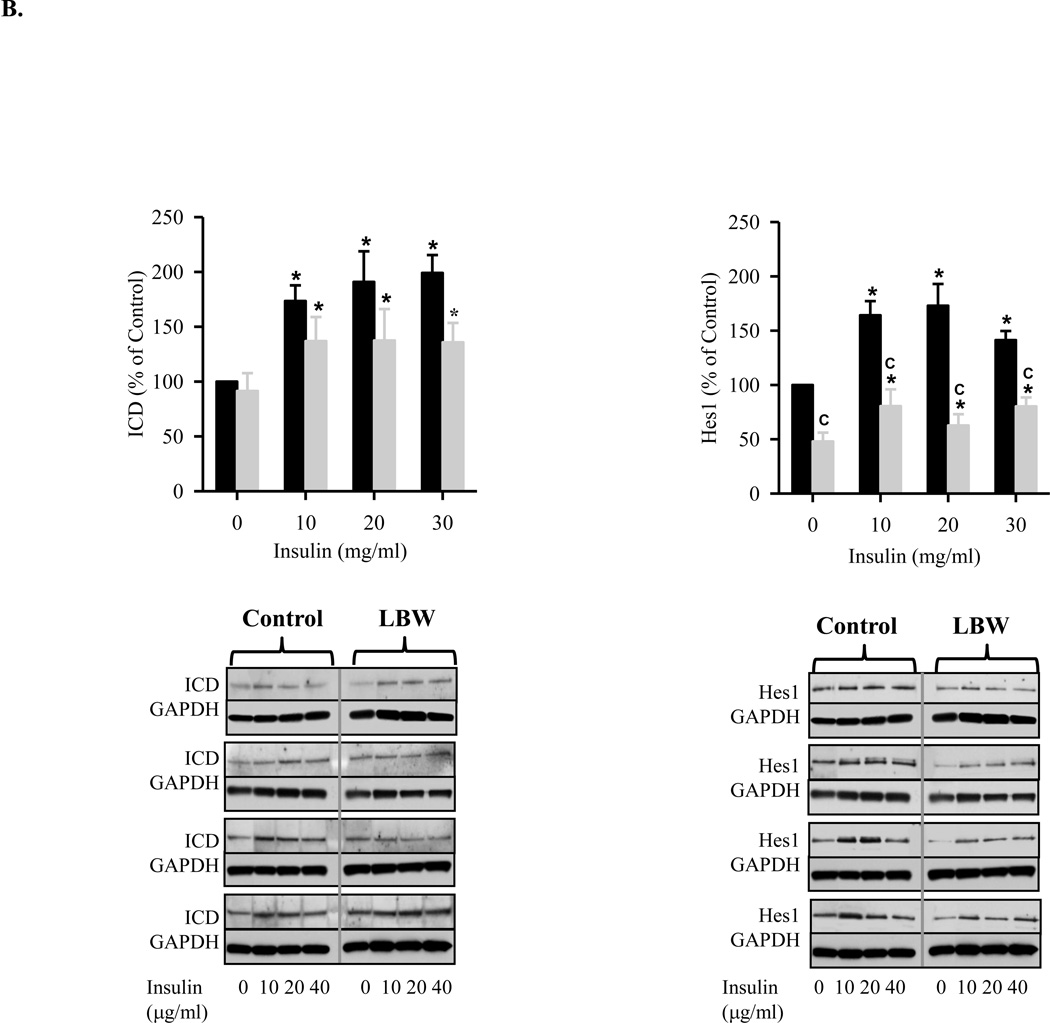 ) and LBW () males were cultured in ) and LBW () males were cultured in
 References
-
- Desai M, Hales CN. Role of fetal and infant growth in programming metabolism in later life. Biol. Rev. Camb. Philos. Soc. 1997;72:329–348. - PubMed
-
- Ravelli AC, Der Meulen JH, Osmond C, Barker DJ, Bleker OP. Obesity at the age of 50 y in men and women exposed to famine prenatally. Am. J. Clin. Nutr. 1999;70:811–816. - PubMed
-
- Ravelli GP, Stein ZA, Susser MW. Obesity in young men after famine exposure in utero and early infancy. N. Engl. J. Med. 1976;295:349–353. - PubMed
-
- Desai M, Babu J, Ross MG. Programmed metabolic syndrome: prenatal undernutrition and postweaning overnutrition. Am J Physiol Regul Integr Comp Physiol. 2007;293:R2306–R2314. - PubMed
-
- Lodygensky GA, Seghier ML, Warfield SK, Tolsa CB, Sizonenko S, Lazeyras F, Huppi PS. Intrauterine growth restriction affects the preterm infant's hippocampus. Pediatr. Res. 2008;63:438–443. - PubMed
Publication types
MeSH terms
Substances
Grants and funding
LinkOut - more resources
Full Text Sources
Medical
Research Materials
Miscellaneous
