

A phase I trial of preventive HIV vaccination with heterologous poxviral-vectors containing matching HIV-1 inserts in healthy HIV-uninfected subjects
- PMID: 21216311
- PMCID: PMC3043112
- DOI: 10.1016/j.vaccine.2010.12.104
A phase I trial of preventive HIV vaccination with heterologous poxviral-vectors containing matching HIV-1 inserts in healthy HIV-uninfected subjects
Abstract
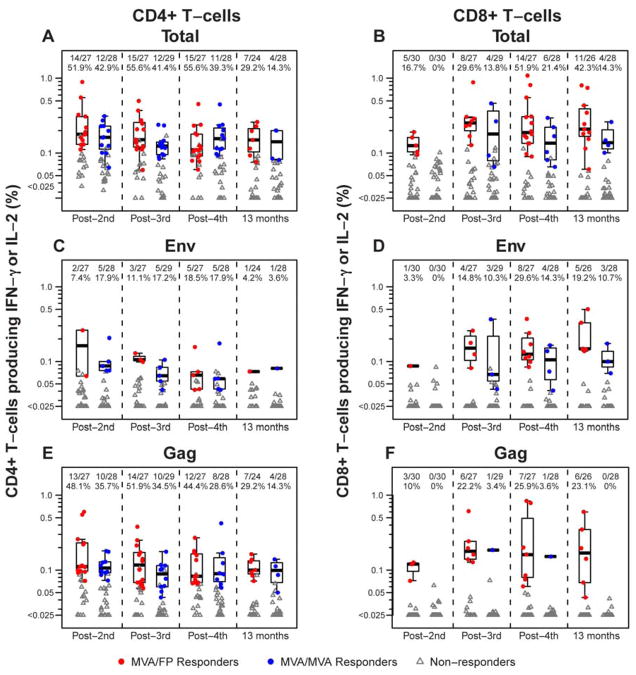
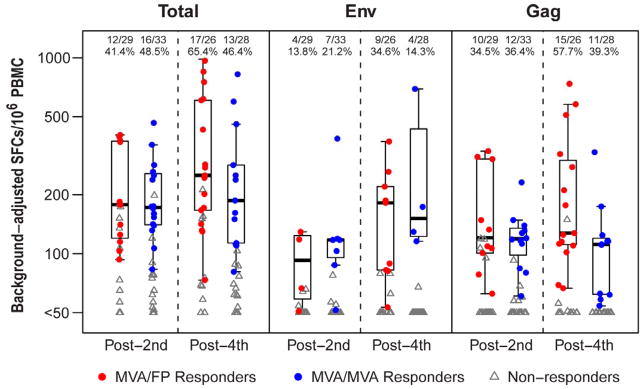
We evaluated replication-defective poxvirus vectors (modified vaccinia Ankara [MVA] and fowlpox [FPV]) in a homologous and heterologous vector prime-boost vaccination regimen containing matching HIV inserts (MVA-HIV and FPV-HIV) given at months 0, 1, 3, 5 and 7 in 150 healthy HIV-negative vaccinia-naïve participants. FPV-HIV alone was poorly immunogenic, while the high dose (10(9)pfu/2 ml) of MVA-HIV alone elicited maximal responses after two injections: CD4+ and CD8+ T-cell responses in 26/55 (47.3%) and 5/60 (8.3%) of participants, respectively, and IFN-γ ELISpot responses in 28/62 (45.2%). The infrequent CD8+ T-cell responses following MVA-HIV priming were boosted only by the heterologous (FPV-HIV) construct in 14/27 (51.9%) of participants post 4th vaccination. Alternatively, HIV envelope-specific binding antibodies were demonstrated in approximately two-thirds of recipients of the homologous boosting regimen, but in less than 20% of subjects after the heterologous vector boost. Thus, a heterologous poxvirus vector prime-boost regimen can induce HIV-specific CD8+ T-cell and CD4+ T-cell responses, which may be an important feature of an optimal regimen for preventive HIV vaccination.
Trial registration: ClinicalTrials.gov NCT00083603.
Copyright © 2011 Elsevier Ltd. All rights reserved.
Conflict of interest statement
Potential conflicts of interest statement: none reported
Figures
References
-
- Fauci AS, Johnston MI, Dieffenbach CW, Burton DR, Hammer SM, Hoxie JA, et al. HIV vaccine research: the way forward. Science. 2008;321:530–2. - PubMed
-
- Walker BD, Burton DR. Toward an AIDS vaccine. Science. 2008;320:760–4. - PubMed
-
- Letvin NL. Moving forward in HIV vaccine development. Science. 2009;326:1196–8. - PubMed
Publication types
MeSH terms
Substances
Associated data
Grants and funding
- U01 AI047996/AI/NIAID NIH HHS/United States
- 1U01 AI069414/AI/NIAID NIH HHS/United States
- U01 AI069420/AI/NIAID NIH HHS/United States
- 1U01 AI048021/AI/NIAID NIH HHS/United States
- U01 AI046725/AI/NIAID NIH HHS/United States
- U01 AI046747/AI/NIAID NIH HHS/United States
- U01 AI068635/AI/NIAID NIH HHS/United States
- UL1 RR024160/RR/NCRR NIH HHS/United States
- 1U01 AI 068614/AI/NIAID NIH HHS/United States
- AI026507/AI/NIAID NIH HHS/United States
- U01 AI047980/AI/NIAID NIH HHS/United States
- 1U01 AI046703/AI/NIAID NIH HHS/United States
- 1U01 AI047996/AI/NIAID NIH HHS/United States
- U01 AI026507/AI/NIAID NIH HHS/United States
- 1U01 AI068614/AI/NIAID NIH HHS/United States
- 1U01 AI046725/AI/NIAID NIH HHS/United States
- 1U01 AI46725/AI/NIAID NIH HHS/United States
- 1U01 AI069511/AI/NIAID NIH HHS/United States
- U01 AI069511/AI/NIAID NIH HHS/United States
- UL1 RR 024160/RR/NCRR NIH HHS/United States
- U01 AI048021/AI/NIAID NIH HHS/United States
- 1U01 AI069420/AI/NIAID NIH HHS/United States
- 1U01 AI068618/AI/NIAID NIH HHS/United States
- 1U01 AI AI047980/AI/NIAID NIH HHS/United States
- U01 AI068618/AI/NIAID NIH HHS/United States
- 1U01 AI069452/AI/NIAID NIH HHS/United States
- UM1 AI069511/AI/NIAID NIH HHS/United States
- U01 AI046703/AI/NIAID NIH HHS/United States
- 1U01 AI046747/AI/NIAID NIH HHS/United States
- U01 AI069452/AI/NIAID NIH HHS/United States
- 1U01 AI068635/AI/NIAID NIH HHS/United States
- U01 AI068614/AI/NIAID NIH HHS/United States
- P01 AI026507/AI/NIAID NIH HHS/United States
- U01 AI069414/AI/NIAID NIH HHS/United States
LinkOut - more resources
Full Text Sources
Other Literature Sources
Medical
Research Materials
