. 2011 Mar 1;71(5):1752-62.
doi: 10.1158/0008-5472.CAN-10-3573. Epub 2011 Jan 7.

Epigenetic silencing mediated through activated PI3K/AKT signaling in breast cancer

Affiliations

Epigenetic silencing mediated through activated PI3K/AKT signaling in breast cancer

Tao Zuo et al. Cancer Res. .

Abstract

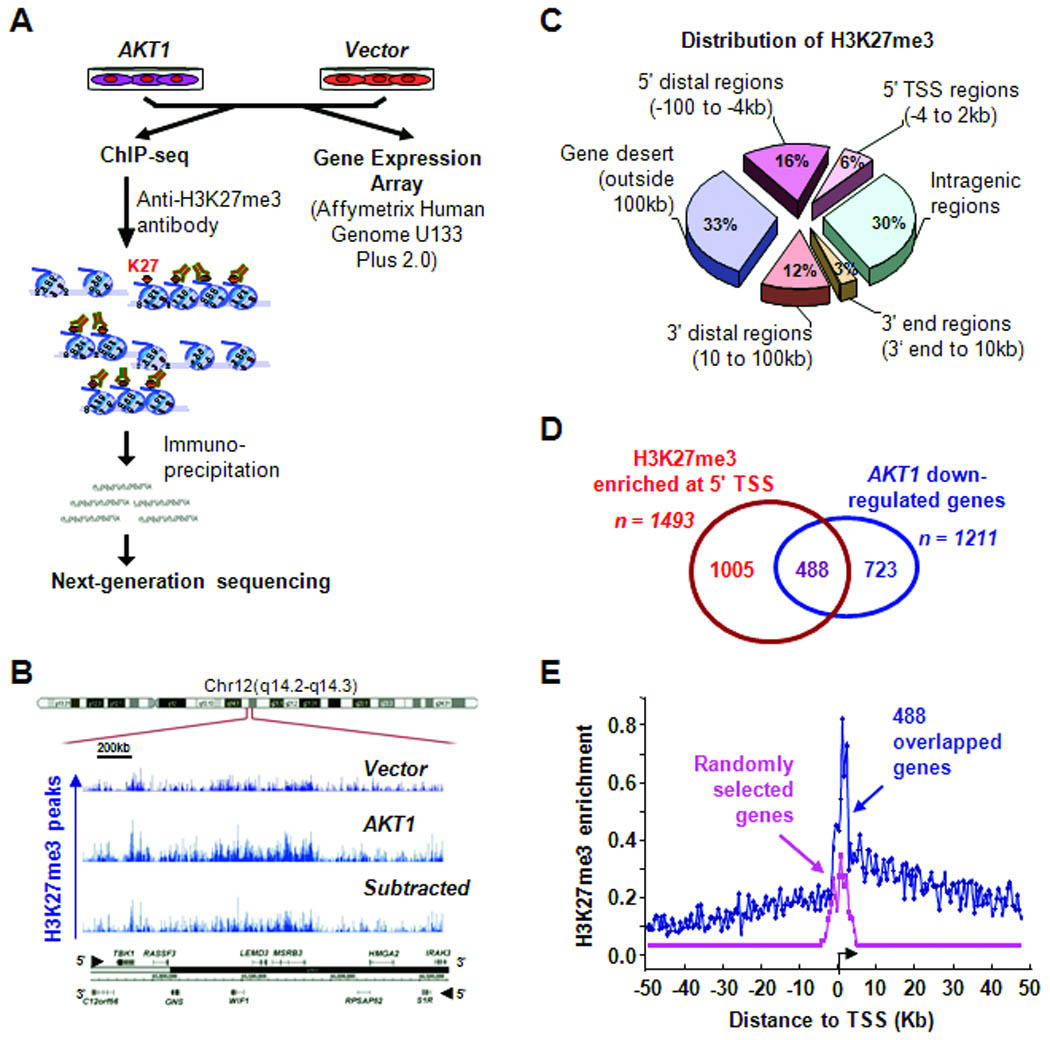
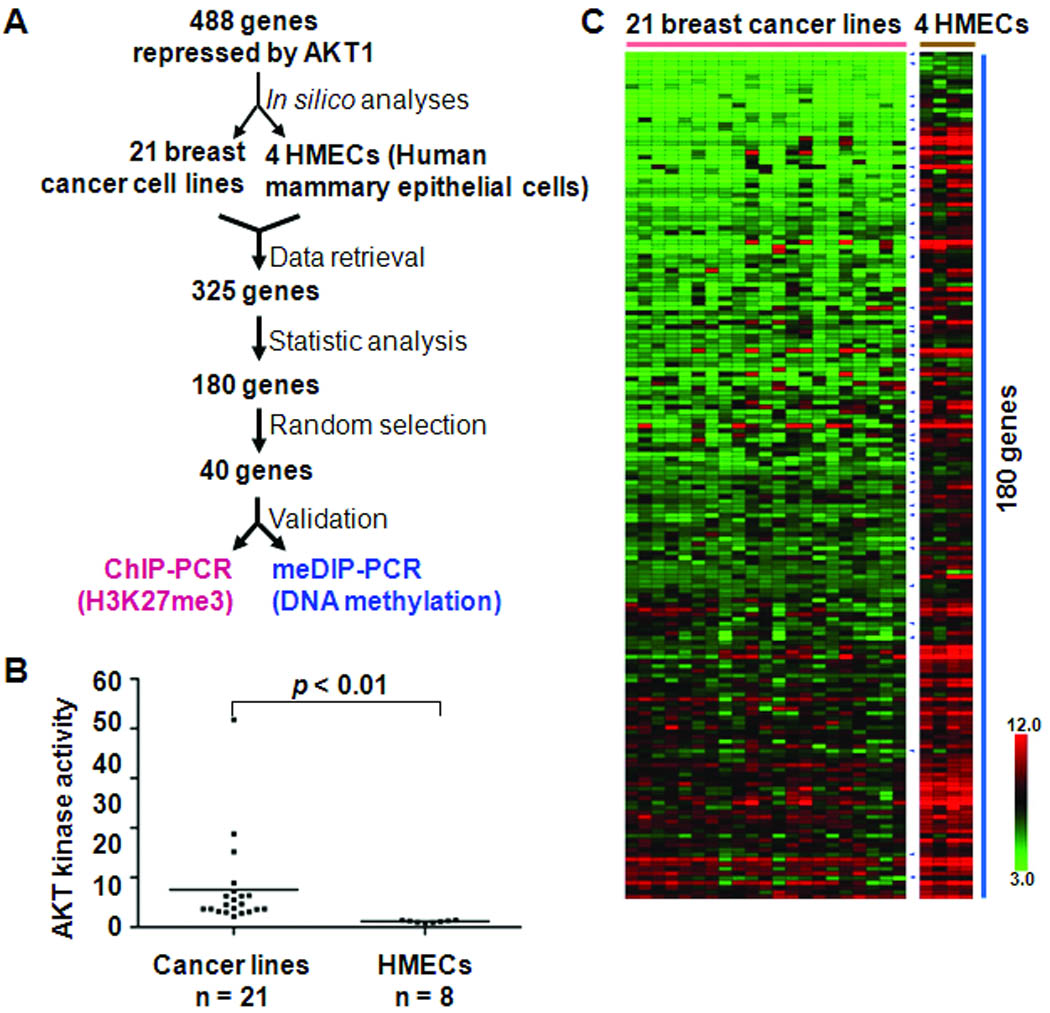
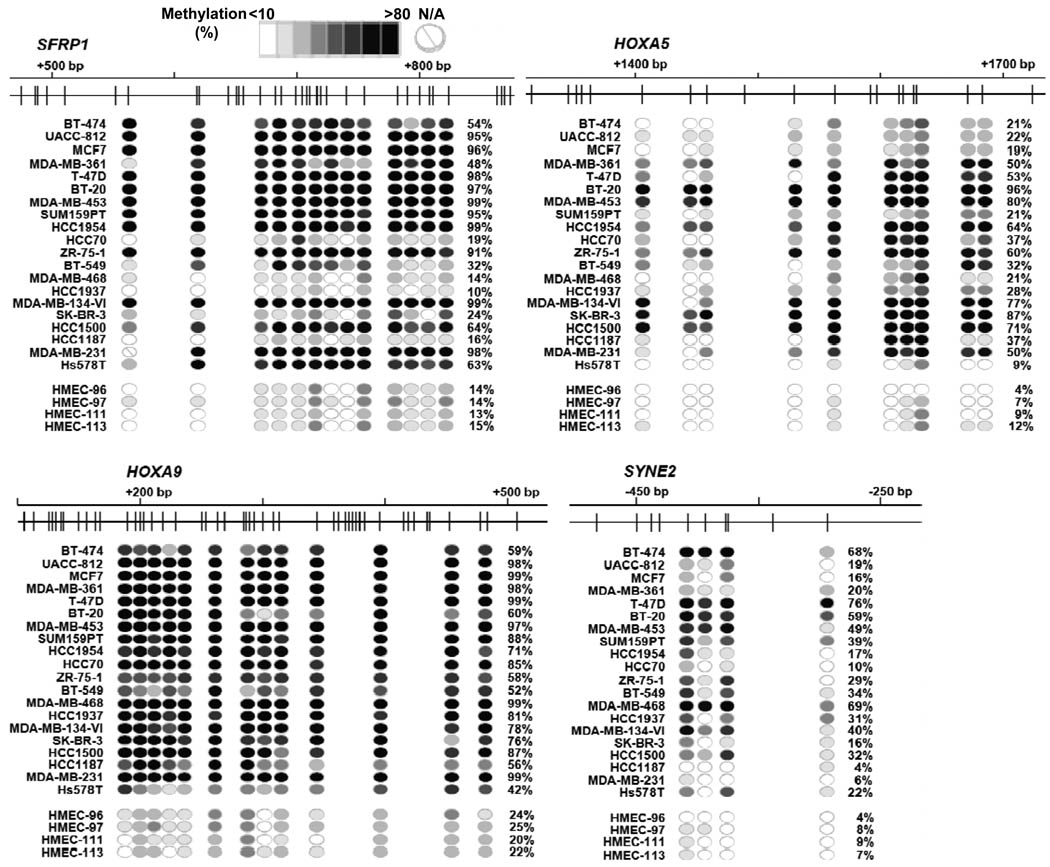
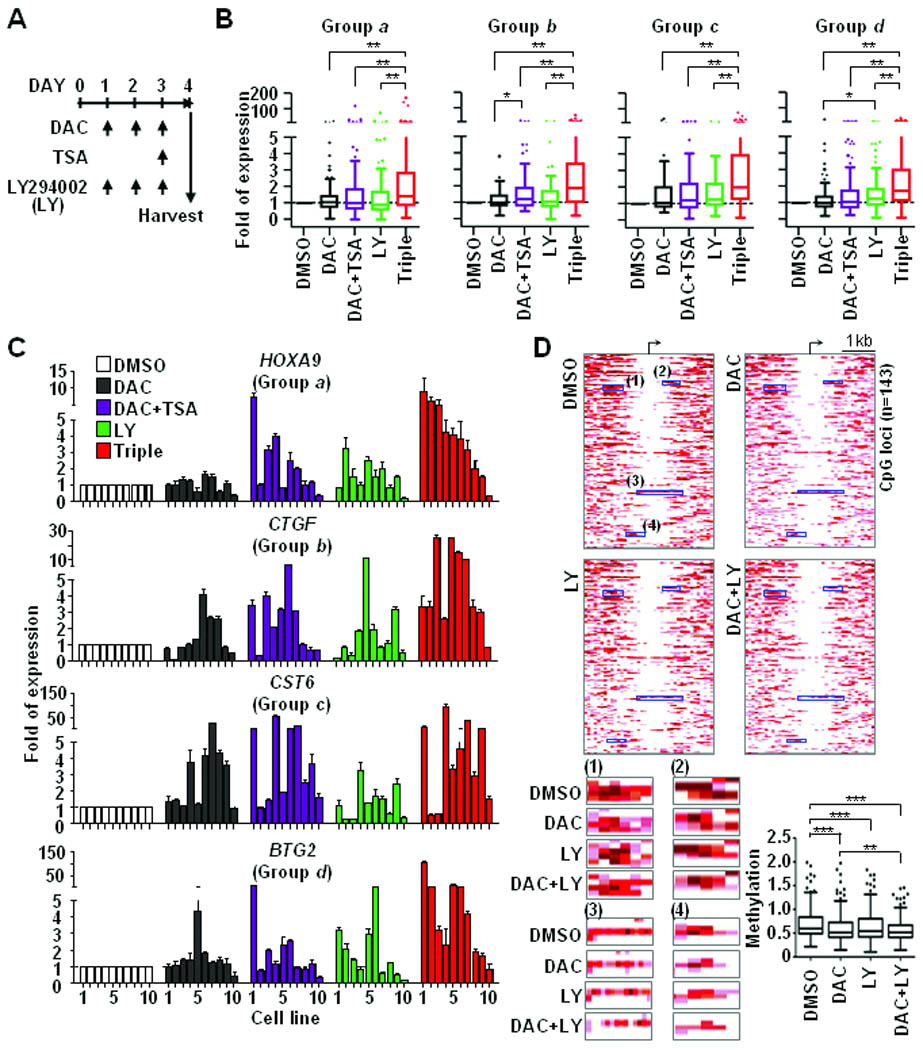
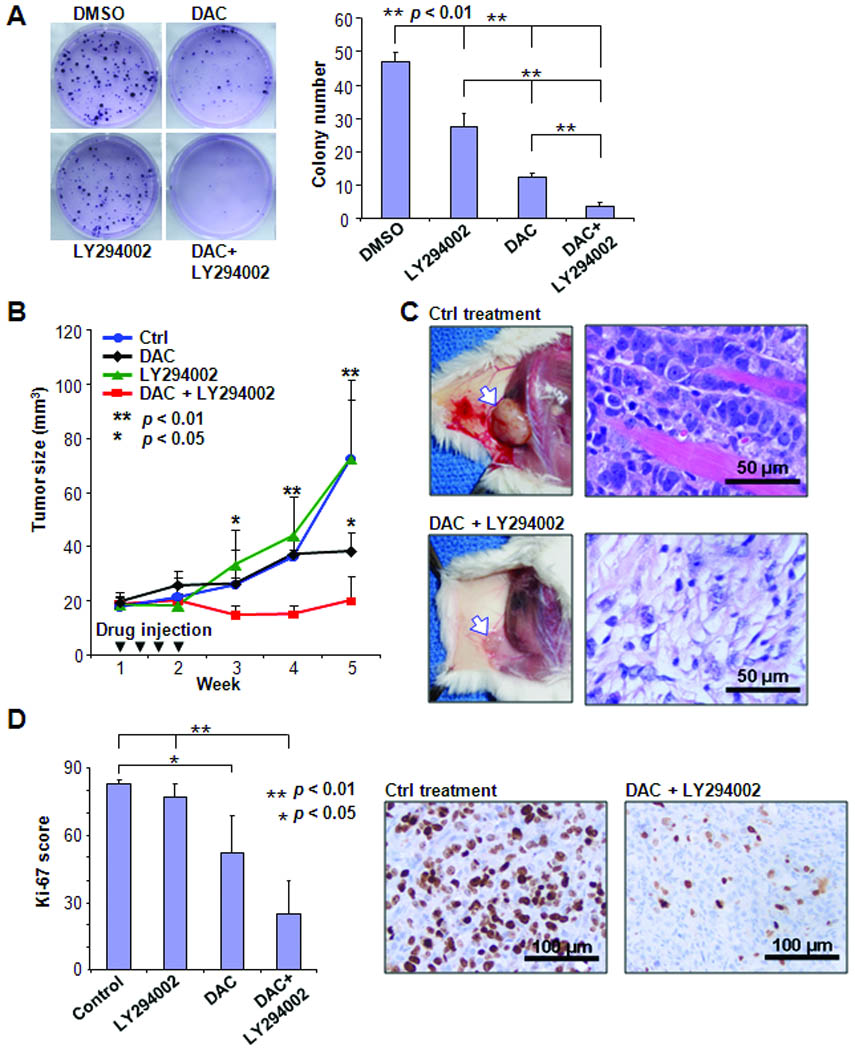
Trimethylation of histone 3 lysine 27 (H3K27me3) is a critical epigenetic mark for the maintenance of gene silencing. Additional accumulation of DNA methylation in target loci is thought to cooperatively support this epigenetic silencing during tumorigenesis. However, molecular mechanisms underlying the complex interplay between the two marks remain to be explored. Here we show that activation of PI3K/AKT signaling can be a trigger of this epigenetic processing at many downstream target genes. We also find that DNA methylation can be acquired at the same loci in cancer cells, thereby reinforcing permanent repression in those losing the H3K27me3 mark. Because of a link between PI3K/AKT signaling and epigenetic alterations, we conducted epigenetic therapies in conjunction with the signaling-targeted treatment. These combined treatments synergistically relieve gene silencing and suppress cancer cell growth in vitro and in xenografts. The new finding has important implications for improving targeted cancer therapies in the future.


Conflict of interest statement

Disclosure of Potential Conflicts of Interest

No potential conflicts of interest were disclosed.

Figures

Figure 1
Figure 1
Genome-wide mapping of H3K27me3 in mammary epithelial cells. A, flow chart shows the experimental design. B, a screenshot represents H3K27me3 enrichment in a genomic region (2.5-Mb) on chromosome 12. C, pie chart demonstrates distribution of H3K27me3 enrichment across the mammary epithelial genome. D, Venn diagram illustrates that 488 loci were marked by H3K27me3 and downregulated by PI3K/AKT signaling. E, enriched peaks of H3K27me3 around 5′ TSS regions are significantly higher at 488 loci than those of randomly selected genes.
Figure 2
Figure 2
Identifying epigenetic silencing induced by PI3K/AKT signaling in breast cancer cells. A, step-wise flow chart shows the identification of genes suppressed by PI3K/AKT oncogenic signaling in breast cancer cells. B, AKT kinase activities were measured in 21 breast cancer cell lines and 8 normal breast epithelial cell samples. Normalized values were plotted in each category of figure. Non-parametric test was performed for statistical analysis. Representative data derived from two or three independent experiments are shown. C, heatmap shows decreased expression of 180 PI3K/AKT-repressed genes in 21 cancer lines, compared to four normal human mammary epithelial cells. Color bar indicates range of gene expression values in log2 scale. Small blue arrowheads point 40 genes randomly selected for validation experiments.
Figure 3
Figure 3
Differential levels of H3K27me3 and DNA methylation in PI3K/AKT-repressed loci. A, as shown in Fig. 2C, 40 genes were randomly selected from PI3K/AKT-suppressed loci and subjected to ChIP- and meDIP-qPCR in 21 cancer lines. Enrichment values of epigenetic marks were transformed by taking the square root and plotted in figures. Box-plot shows distribution of levels for H3K27me3 (upper) and DNA methylation (lower) across all samples. The bottom and top of the box, as well as the line in between, indicate the lower, upper and median quartiles of data, respectively. Representative data were derived from at least two independent experiments. B, heatmaps show H3K27me3 (pink) and DNA methylation (blue) of 26 genes in panel A.
Figure 4
Figure 4
Validation of DNA methylation by MassARRAY. Methylation profiles of 4 genes, i.e., SFRP1, HOXA5, HOXA9, and SYNE2, were carefully measured in 20 breast cancer cell lines and 8 normal breast epithelial cell samples by MassARRAY analysis. For each gene, upper panel shows a genome map with locations of CpG sites (vertical bars), and lower panel illustrates DNA methylation at each CpG unit (circle) of different samples, with intensity of blue color indicating methylation level. N/A, not analyzable
Figure 5
Figure 5
Combined PI3K/AKT-targeted epigenetic therapies synergistically relieve epigenetic repression. A, scheme chart illustrates drug treatment plan. A DNA demethylation reagent (DAC, 1 µM), an inhibitor of histone deacetylases (TSA, 0.2 µM) and a non-specific PI3K inhibitor (LY294002, 5 µM) were used to treat 10 breast cancer cell lines as indicated. B, RT-qPCR was conducted to measure expressions of 40 genes after drug treatments. Values of gene expression in each treatment were normalized by comparing those of DMSO control. Following categorization showed in Fig. 3, genes from groups a, b, c and d were summarized in four box-plots separately. Three independent experiments were conducted and representative data was shown in figures. C, expression changes of representative genes, i.e. HOXA9, CTGF, CST6, and BTG2, are shown. The order of cell lines: 1 MDA-MB-453; 2 MCF7; 3 ZR-75-1; 4 BT-549; 5 MDA-MB-468; 6 BT-474; 7 T-47D; 8 HCC1954; 9 Hs578T; 10 MDA-MB-231. D, global MBDCap-seq was conducted to analyze DNA methylation changes in drug-treated T-47D cancer cells. Enrichment levels of DNA methylation in promoter CpG islands were statistically normalized. Heatmaps, upper panel, show differential methylation patterns of 143 loci that were plotted in a 4-kb window (2-kb up- and down-stream from the transcription start site). The detail methylation changes in four representative regions in heatmaps are illustrated at lower panel (left), while box plots (right) summarize the overall methylation levels of 143 loci in four different treatment groups. Significance of differences among drug treatments was determined by Student’s t-test and One-way ANOVA test. *P<0.05, **P<0.01, and ***P<0.001.
Figure 6
Figure 6
Combinatorial treatment suppresses tumor growth. A, T-47D cancer cells were treated with DAC or/and LY294002 and subjected to colony counting. Left, photos show representative from each treatment. Right, results were derived from three independent experiments. B, five million T-47D cancer cells were inoculated on flank of each female NOD SCID mouse. Each treatment was conducted on 5 experimental animals by intratumor injections of either drugs or vehicle control for totally four times during first two weeks of treatment. Tumor growth was carefully followed until 5 weeks after beginning of treatment. C, photos illustrate representative xengraft tumors in control (upper panel) and drug treated (lower panel) mice. Arrow indicates inoculated tumors. H&E stain shows that cancer cells invaded pink muscle-fibers in control xenograft tumor, while morphology of tumor cells was dramatically changed after drug treatment. D, Immunohistochemical analysis of Ki-67 was performed in xenograft tumor tissues. Left, Ki-67 scores measured from three tumors in each group were summarized in column figure. Right, representative Ki-67 immunohistochemical sections from tumor tissues treated with either vehicle control or drugs.

References

    1. Esteller M. Epigenetics in cancer. N Engl J Med. 2008;358:1148–1159. - PubMed
    1. Jones PA, Baylin SB. The epigenomics of cancer. Cell. 2007;128:683–692. - PMC - PubMed
    1. Bracken AP, Helin K. Polycomb group proteins: navigators of lineage pathways led astray in cancer. Nat Rev Cancer. 2009;9:773–784. - PubMed
    1. Cedar H, Bergman Y. Linking DNA methylation and histone modification: patterns and paradigms. Nat Rev Genet. 2009;10:295–304. - PubMed
    1. Lo PK, Sukumar S. Epigenomics and breast cancer. Pharmacogenomics. 2008;9:1879–1902. - PMC - PubMed

Publication types

MeSH terms