. 2011 Jan;23(1):185-209.
doi: 10.1105/tpc.110.074005. Epub 2011 Jan 7.

The PP2A regulatory subunit Tap46, a component of the TOR signaling pathway, modulates growth and metabolism in plants

Affiliations

The PP2A regulatory subunit Tap46, a component of the TOR signaling pathway, modulates growth and metabolism in plants

Chang Sook Ahn et al. Plant Cell. 2011 Jan.

Abstract

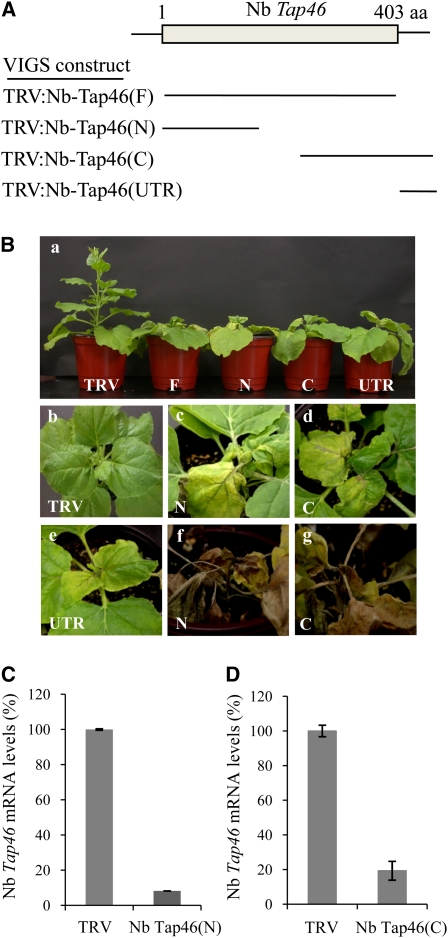
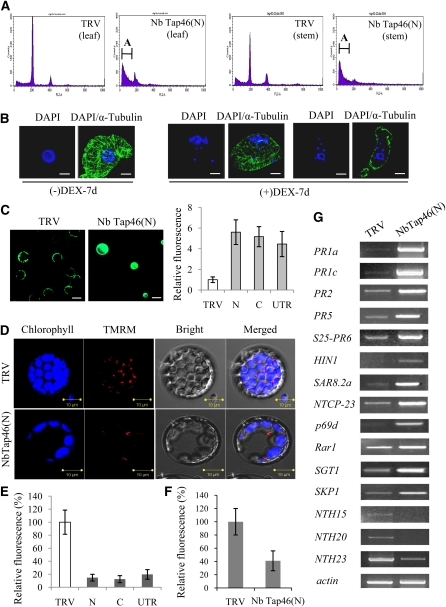
Tap42/α4, a regulatory subunit of protein phosphatase 2A, is a downstream effector of the target of rapamycin (TOR) protein kinase, which regulates cell growth in coordination with nutrient and environmental conditions in yeast and mammals. In this study, we characterized the functions and phosphatase regulation of plant Tap46. Depletion of Tap46 resulted in growth arrest and acute plant death with morphological markers of programmed cell death. Tap46 interacted with PP2A and PP2A-like phosphatases PP4 and PP6. Tap46 silencing modulated cellular PP2A activities in a time-dependent fashion similar to TOR silencing. Immunoprecipitated full-length and deletion forms of Arabidopsis thaliana TOR phosphorylated recombinant Tap46 protein in vitro, supporting a functional link between Tap46 and TOR. Tap46 depletion reproduced the signature phenotypes of TOR inactivation, such as dramatic repression of global translation and activation of autophagy and nitrogen mobilization, indicating that Tap46 may act as a positive effector of TOR signaling in controlling those processes. Additionally, Tap46 silencing in tobacco (Nicotiana tabacum) BY-2 cells caused chromatin bridge formation at anaphase, indicating its role in sister chromatid segregation. These findings suggest that Tap46, in conjunction with associated phosphatases, plays an essential role in plant growth and development as a component of the TOR signaling pathway.


Figures

Figure 1.
Figure 1.
VIGS Constructs, Phenotypes, and Suppression of Nb Tap46 Transcripts. (A) Schematic drawing of Nb Tap46 structure showing the four VIGS constructs (F, N, C, and UTR) containing different Nb Tap46 cDNA fragments (indicated by bars). aa, amino acids. (B) Growth arrest and cell death phenotypes of Nb Tap46 VIGS plants and the phenotype of control TRV at 17 DAI (a to e). The Nb Tap46 VIGS plants perished before 30 DAI (f and g). (C) Real-time quantitative RT-PCR analysis of Nb Tap46 transcript levels in TRV:Nb-Tap46(N) lines using Nb Tap46-C2 primers. The β-tubulin mRNA level was included as a control. Data points represent mean ± sd of three replicates using multiple VIGS plants. (D) Real-time quantitative RT-PCR analysis of Nb Tap46 transcript levels in TRV:Nb-Tap46(C) lines using Nb Tap46-N2 primers. Data points represent mean ± sd of three replicates using multiple VIGS plants.
Figure 2.
Figure 2.
Phenotypes of PCD. (A) Nuclear DNA fragmentation was examined by flow cytometry in leaf and stem cells of TRV:Nb-Tap46(N) lines at 20 DAI. Nuclei isolated from the fourth leaf above the infiltrated leaf or from stems near the shoot apex were stained with propidium iodide and analyzed by flow cytometry. TRV control plants were analyzed as a control. Brackets and “A” mark apoptotic nuclei with fractional (sub-G1) DNA contents. (B) Nuclear fragmentation in DEX-inducible Nb Tap46 RNAi BY-2 cells. BY-2 cells in interphase were stained with anti-α-tubulin antibodies (green) and DAPI (blue) after 7 d of ethanol (−DEX) or DEX treatment (+DEX) and examined by confocal laser scanning microscopy. Bars = 10 μm. (C) Excessive production of ROS. Leaf protoplasts from TRV and TRV:Nb-Tap46(N) (17 DAI) were incubated with the ROS indicator H2DCFDA (2 μM) and observed under confocal microscopy (left). Relative H2DCFDA fluorescence of protoplasts from TRV, TRV:Nb-Tap46(N), TRV:Nb-Tap46(C), and TRV:Nb-Tap46(UTR) VIGS lines was quantified by confocal microscopy (right). Data points represent means ± sd of 30 individual protoplasts. Bars = 50 μm. (D) to (F) Mitochondrial membrane integrity. Leaf protoplasts from VIGS lines (17 DAI) were observed after staining with TMRM (200 nM) (D). TMRM fluorescence (E) and chlorophyll autofluorescence (F) were quantified. Data points represent means ± sd of 30 individual protoplasts. (G) RT-PCR analysis of transcript levels of cell death and defense-related genes. Total RNA was extracted from the fourth leaf above the infiltrated leaves of TRV and TRV:Nb-Tap46(N) lines (17 DAI). As controls, mRNA levels of actin and three tobacco homeobox genes (NTH15, NTH20, and NTH23) involved in cell growth were also examined.
Figure 3.
Figure 3.
Cell Death Phenotypes of Arabidopsis DEX-Inducible Tap46 RNAi Lines. (A) Cell death phenotypes of the Tap46 RNAi lines following DEX treatment. Wild-type (WT) and transgenic RNAi plants (#12 and #16) were grown for 2 weeks and then sprayed with ethanol (−DEX) or 30 μM DEX (+DEX) for 9 d. (B) Confocal images of the TUNEL assay in leaves of the RNAi plants (#16) after ethanol (−DEX) or DEX treatment (+DEX) for 3 or 7 d. Leaves were counterstained with DAPI. For a positive control, fixed leaf material of (−)DEX samples (ethanol treated for 7 d) was subjected to DNase I treatment. The experiment was repeated three times giving similar results, and representative images are shown. Bars = 50 μm. (C) Relative Tap46 transcript levels in the RNAi lines. Real-time quantitative RT-PCR analysis was performed with two independent RNAi lines (#12 and #16) and wild-type plants after 3 and 7 DOD. Quantification of the relative transcript levels compared with the (−)DEX sample is shown. DEX treatment resulted in reduced levels of the Tap46 mRNA in the RNAi plants. Each value represents the mean ± sd of three replicates per experiment.
Figure 4.
Figure 4.
Analyses of Interactions between Tap46 and Protein Phosphatases. (A) Yeast two-hybrid interactions between Nb Tap46 and NPP1 (type 1 PP), NPP4 (type 2A PP), NPP5 (type 2A PP), and mutants of NPP4 and NPP5 (mNPP4 and mNPP5). LexA-NbTap46 was combined with B42AD fusions of the protein phosphatases and their mutants. Yeast growth on selection medium (−His/−Leu/−Trp) and β-galactosidase activity were monitored as indicators of the protein–protein interaction. Three separate colonies per construct were selected for measurement of β-galactosidase activity. Asterisks denote statistical significance as follows: *P ≤ 0.05; **P ≤ 0.01. (B) Sequence alignment of the putative Tap42 binding domain of PP2A and PP2A-related phosphatases. Sit4, yeast PP6; Pph22, yeast PP2Ac; h PP2Ac, human PP2Ac; h PP4, human PP4; At PP2A-2 and At PP2A-4, Arabidopsis PP2Ac; NPP4 and NPP5, tobacco PP2Ac; mNPP4 and mNPP5, mutant NPP4 and NPP5. Point mutations in mNPP4 and mNPP5 are indicated by red letters. (C) Visualization of Nb Tap46-NPP4/5 interaction in the cytosol using BiFC. Nb-Tap46:YFPN was expressed together with NPP1:YFPC, NPP4:YFPC, or NPP5:YFPC fusion proteins in N. benthamiana leaves by agroinfiltration of pSPYNE-NbTap46 and pSPYCE-NPP1/4/5 constructs. (D) Subcellular localization of Nb Tap46, NPP4, and NPP5. N. benthamiana protoplasts were transformed with Nb-Tap46:GFP, NPP4:GFP, and NPP5:GFP fusion constructs and examined 24 h later by confocal laser scanning microscopy. Arrows indicate nuclei. (E) Yeast two-hybrid interactions between Arabidopsis Tap46 and Arabidopsis protein phosphatases. The Arabidopsis protein phosphatases examined in this assay are shown in Supplemental Figure 13 online. PP2A-2 and PP2A-4 are most closely related to NPP4 and NPP5, respectively. Yeast growth on selection medium (−His/−Leu/−Trp) and β-galactosidase activity were monitored as indicators of protein–protein interaction. Three separate colonies per construct were selected for measurement of β-galactosidase activity. Asterisks denote the statistical significance of the differences between the results for pB42AD and other samples. (F) Coimmunoprecipitation. Protein extracts were prepared from N. benthamiana leaves simultaneously expressing HA:Tap46 and PP2A-4:Flag fusion proteins (top) or HA:Tap46 and PP4:Flag (bottom). Extracts were subjected to immunoprecipitation (IP) with anti-HA antibodies, and coimmunoprecipitated PP2A-4:Flag and PP4:Flag were detected by immunoblotting (IB) with anti-Flag antibodies. To check the efficiency of IP, the precipitated fractions were also reacted with the anti-HA antibodies. When PP2A-4:Flag and PP4:Flag fusion proteins were individually expressed, immunoprecipitation with the anti-HA antibodies did not result in precipitation of PP2A-4:Flag or PP4:Flag proteins.
Figure 5.
Figure 5.
Modulation of PP2A Activities in Tap46- and TOR-Silenced Plants (A) Time-dependent regulation of total cellular PP2A activities in the Tap46 RNAi Arabidopsis plants (lines #12 and #16) with ethanol (−DEX) or DEX treatment (+DEX) for 1 to 6 d. Protein fractions were prepared from whole seedlings after 1 to 6 d of treatment. The PP2A activity is shown in pmol of inorganic phosphate (Pi) released per minute and per microgram of total proteins. Asterisks denote the statistical significance of the differences between the results for (−)DEX and (+)DEX samples on each day. (B) Time-dependent regulation of total cellular PP2A activities in the ethanol-inducible TOR RNAi Arabidopsis plants with water (−ethanol) or 50 mM ethanol treatment (+ethanol) for 1, 3, and 7 d. Asterisks denote the statistical significance of the differences between the results for (−)ethanol and (+)ethanol samples on each day. (C) Total PP2A activity in leaf extracts from TRV, TRV:NPP(UTR), TRV:Nb-Tap46(N), and TRV:Nb-TOR N. benthamiana VIGS lines at 10 DAI. The PP2A activity is shown in pmol of inorganic phosphate (Pi) released per minute and per microgram of total proteins. Data points represent means ± sd of three replicate experiments. (D) Immunoblot analyses to detect cellular PP2Ac protein levels. Thirty micrograms of total proteins isolated from the Arabidopsis wild-type (WT) and Tap46 RNAi lines (#12 and #16) after 3 and 7 DOD and from the TOR RNAi lines after 7 d of ethanol treatment were subjected to immunoblotting with the anti-PP2Ac antibodies. Immunoblotting with anti-α-tubulin antibody was performed as a control for equal loading.
Figure 6.
Figure 6.
In Vitro Phosphorylation of Tap46 by TOR Protein Kinase (A) Schematic representation of Arabidopsis full-length TOR, showing the HEAT repeats, FAT domain, PI3/PI4 kinase catalytic domain, FATC domain, and TOR deletion forms. (B) Immunoprecipitation of TOR:Flag and in vitro kinase assay. The full-length TOR:Flag fusion construct and the vector control were transfected into HEK293 cells. After immunoprecipitation with anti-Flag antibodies, the TOR:Flag protein construct was detected by immunoblotting with anti-Flag antibodies. In vitro kinase assay of immunoprecipitated TOR:Flag was performed with purified Tap46:His protein as a substrate. Phosphorylated Tap46:His proteins were detected by autoradiography using a phosphor imager. A duplicate gel was stained with Coomassie blue to show Tap46:His proteins. (C) Immunoprecipitation of TOR deletion forms. Constructs of Myc-tagged TOR-C (TOR-C:Myc), Flag-tagged TOR-KD (TOR-KD:Flag), and the control Myc-tagged PI3K (PI3K:Myc) were agroinfiltrated into N. benthamiana leaves. Immunoprecipitation and immunoblotting were performed with anti-Myc or anti-Flag antibodies. (D) In vitro kinase assay of immunoprecipitated TOR-C:Myc, TOR-KD:Flag, and the control PI3K:Myc with Tap46:His protein as a substrate. Phosphorylated Tap46:His proteins were detected by autoradiography. A duplicate gel was stained with Coomassie blue to show Tap46:His proteins.
Figure 7.
Figure 7.
Ribosome Profiles and 35S-Met Incorporation. (A) Absorbance profile of ribosomes at 254 nm. Ribosomes were purified from leaves of TRV, TRV:Nb-TOR, and TRV:Nb-Tap46(N) lines using ultracentrifugation on a sucrose density gradient. Experiments were repeated at least three times, and a representative image is shown. The positions of ribosome small subunits (40S), large subunits and monosomes (60S/80S), and polysomes are marked. (B) Absorbance profile of ribosomes in Nb Tap46 RNAi BY-2 cells at 254 nm. Ribosomes were purified from Nb Tap46 RNAi BY-2 cells after 3 d of ethanol (−DEX) or DEX treatment (+DEX). As a control, puromycin treatment of a (−)DEX sample resulted in increased accumulation of monosomes and abolition of polysome accumulation. Note that the OD scale is different for each sample. (C) 35S-Met incorporation. Leaves of Arabidopsis Tap46 RNAi lines were treated with 35S-Met after 3 d of ethanol (−DEX) or DEX treatment (+DEX). Total leaf protein extracts were separated by SDS-PAGE, and the gel was dried and analyzed by a phosphor imager. A duplicate gel was stained with Coomassie blue to show ribulose-1,5-bisphosphate carboxylase/oxygenase large subunits (RbcL) as a loading control. WT, wild type.
Figure 8.
Figure 8.
Activation of Autophagy. (A) LTR staining of autophagosome-like structures in leaf protoplasts isolated from TRV, TRV:Nb-Tap46(N), TRV:Nb-TOR, and TRV:NPP5(UTR) lines at 10 DAI. Merged images of LTR-stained punctuate autophagosome-like structures and chlorophyll autofluorescence (pseudocolored blue) are shown. (B) LTR-derived red fluorescence of the protoplasts shown in (A) was quantified by confocal microscopy. Data points represent means ± sd of 30 individual protoplasts. (C) Confocal microscopy of transiently expressed GFP:ATG8e in leaf protoplasts isolated from TRV, TRV:Nb-Tap46(N), TRV:Nb-TOR, and TRV:NPP5(UTR) lines at 10 DAI. (D) GFP:ATG8e-derived green fluorescence of the protoplasts shown in (C) was quantified by confocal microscopy. Data points represent means ± sd of 30 individual protoplasts. (E) LysoTracker staining of autophagosome-like structures in leaf protoplasts from Arabidopsis Tap46 RNAi lines (#16) after 3 d of ethanol (−DEX) or DEX treatment (+DEX). (F) LTR-derived red fluorescence of the protoplasts shown in (E) was quantified by confocal microscopy. Data points represent means ± sd of 30 individual protoplasts. (G) to (J) Representative transmission electron microscopy images of the cytoplasm in mesophyll cells of TRV (G) and TRV:Nb-Tap46(N) lines ([H] to [J]) at 10 DAI. Abundant autophagosome/autolysosome structures are evident near plasma membranes in TRV:Nb-Tap46(N) lines ([H] to [J]). Bars = 5 μm in (G), 2 μm in (H), and 0.2 μm in (I) and (J).
Figure 9.
Figure 9.
Reduced Primary Nitrogen Assimilation and Induction of Nitrogen Recycling. (A) NR activities in seedlings of Arabidopsis Tap46 RNAi lines (#12 and #16) after 3 and 7 d of ethanol (−DEX) or DEX treatment (+DEX). Data points represent means ± sd of three experiments. Asterisks denote the statistical significance of the differences between the results for (−)DEX and (+)DEX samples on each day. WT, wild type. (B) NR activities in wild-type and constitutive TOR RNAi Arabidopsis plants at 25 d after sowing. (C) NR activities in leaf extracts from TRV, TRV:Nb-Tap46(N), and TRV:NR2 VIGS lines at 10 DAI and from TRV and TRV:Nb-TOR lines at 15 DAI. NR2 encodes N. benthamiana NR. (D) Real-time quantitative RT-PCR analysis of expression of nitrogen metabolism genes in seedlings of Arabidopsis Tap46 RNAi lines (#16) after 3 DOD. The transcript levels in (+)DEX samples are expressed relative to those in (−)DEX samples. (E) Ratio of Gln to total free amino acids given as a percentage in seedlings of Arabidopsis Tap46 RNAi lines (#16) after 3 DOD.
Figure 10.
Figure 10.
Formation of Anaphase Chromosome Bridges in Nb Tap46 RNAi BY-2 Cells (A) Confocal laser scanning micrographs of DAPI-stained chromatin showing anaphase bridges in Nb Tap46 RNAi BY-2 cells after 2 DOD. Bars = 10 μm. (B) Confocal laser scanning micrographs of chromosome dynamics and segregation. Nb Tap46 RNAi BY-2 cells were DAPI stained (blue) and immunolabeled with anti-α-tubulin antibodies (green) during mitotic stages following 48 h treatment with ethanol (−DEX) or 15 μM DEX (+DEX). Representative images of each mitotic stage are shown. The arrows mark chromatin bridges. Bars = 10 μm. (C) Chromatin bridges in a three-dimensional image of newly formed daughter cells after 2 DOD. Bars = 10 μm. (D) Percentage of mitotic cells exhibiting the anaphase bridge defect in Nb Tap46 RNAi BY-2 cells after 2 d of ethanol or DEX treatment. Data points represent means ± sd of three independent experiments, counting >300 cells in the mitotic phase for each experiment.
Figure 11.
Figure 11.
Schematic Models of Tap46/Tap42/α4 Functions in TOR Signaling Pathways in Eukaryotes. (A) TOR signaling in yeast. There are two functionally distinct TOR complexes in yeast, TORC1 and TORC2. TOR complex 1 (TORC1) contains KOG1, TCO89, LST8, and either TOR1 or TOR2. TORC1 mediates rapamycin-sensitive TOR functions that lead to activation of translation, inhibition of transcription of starvation-responsive genes, and inhibition of protein turnover. Tap42 and Sch9 (an AGC family kinase) are important direct effectors of TORC1. Tap42 interacts with PP2Ac and PP2Ac-like phosphatase subunits and regulates the activity of downstream effectors, such as NPR1, GCN2, and GLN3, for the control of permease turnover, translation, and transcription of starvation-responsive genes, respectively. Sch9 regulates the activity of RNA polymerases I and III to affect ribosome biogenesis among many other functions. TOR complex 2 (TORC2) consists of TOR2, LST8, AVO1, AVO2, and AVO3. TORC2 is insensitive to rapamycin and mediates actin cytoskeleton organization. AVO, adheres voraciously to TOR2; GCN2, general control nonderepressible 2; GLN3, glutamine metabolism 3; KOG1, kontroller of growth 1; LST8, lethal with sec thirteen protein 8; NPR1, nitrogen permease reactivator 1; TCO89, TOR complex one 89. (B) mTOR signaling in mammals. Growth factors and nutrients activate, while stress inactivates, the mammailan TOR complex 1 (mTORC1) that consists of mTOR, Raptor, and mLST8. α4 is the Tap42 homolog in mammals and interacts with PP2Ac and PP2Ac-like subunits. mTORC1 controls cell growth and protein synthesis through the action of S6K (translation activator) and 4E-BP (translation inhibitor). Phosphorylation of S6K and 4E-BP promotes translation via RPS6 and eIF4E, respectively. The α4-PP2Ac complex may control the activity of the effectors S6K and 4E-BP. The α4-PP2Ac is also involved in the repression of apoptosis. The mTORC2 complex that is insensitive to rapamycin consists of mTOR, Rictor, mLST8, and mSin1 and mediates actin cytoskeleton organization. 4E-BP, eukaryotic initiation factor 4E binding protein; eIF4E, eukaryotic initiation factor 4E; mSin1, stress-activated map kinase-interacting protein 1; Raptor, regulatory associated protein of mTOR (KOG1 homolog); Rictor, rapamycin-insensitive companion of mTOR; RPS6, ribosomal protein S6; S6K, ribosomal S6 protein kinase. (C) TOR signaling in plants. The plant TOR complex regulates plant growth, translation, and metabolism in response to growth signals, nutrients, and environmental conditions. The plant TOR complex may consist of TOR, Raptor, and LST8. The TOR complex promotes cell growth and translation through the regulation of S6K and its substrate RPS6. Our results suggest that Tap46 and its associated PP2Ac and PP2Ac-like subunits play a critical role in mediating TOR signaling, leading to the promotion of protein translation and the repression of autophagy, nutrient recycling, and PCD/senescence. It is not known whether TORC2 is present in plants.

References

    1. Ahn J.W., Kim M., Lim J.H., Kim G.T., Pai H.S. (2004). Phytocalpain controls the proliferation and differentiation fates of cells in plant organ development. Plant J. 38: 969–981 - PubMed
    1. Aoyama T., Chua N.-H. (1997). A glucocorticoid-mediated transcriptional induction system in transgenic plants. Plant J. 11: 605–612 - PubMed
    1. Aranda-Orgillés B., Aigner J., Kunath M., Lurz R., Schneider R., Schweiger S. (2008). Active transport of the ubiquitin ligase MID1 along the microtubules is regulated by protein phosphatase 2A. PLoS ONE 3: e3507. - PMC - PubMed
    1. Azevedo C., Sadanandom A., Kitagawa K., Freialdenhoven A., Shirasu K., Schulze-Lefert P. (2002). The RAR1 interactor SGT1, an essential component of R gene-triggered disease resistance. Science 295: 2073–2076 - PubMed
    1. Banno H., Hirano K., Nakamura T., Irie K., Nomoto S., Matsumoto K., Machida Y. (1993). NPK1, a tobacco gene that encodes a protein with a domain homologous to yeast BCK1, STE11, and Byr2 protein kinases. Mol. Cell. Biol. 13: 4745–4752 - PMC - PubMed

Publication types

MeSH terms