. 2011 Mar 4;286(9):7661-8.
doi: 10.1074/jbc.M110.176354. Epub 2011 Jan 7.

Human T-lymphotropic virus type 1 p30 interacts with REGgamma and modulates ATM (ataxia telangiectasia mutated) to promote cell survival

Affiliations

Human T-lymphotropic virus type 1 p30 interacts with REGgamma and modulates ATM (ataxia telangiectasia mutated) to promote cell survival

Rajaneesh Anupam et al. J Biol Chem. .

Abstract

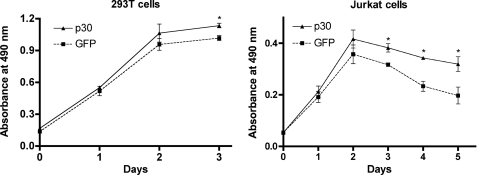
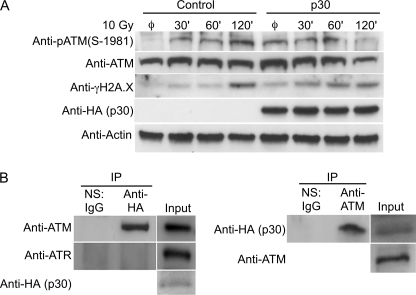
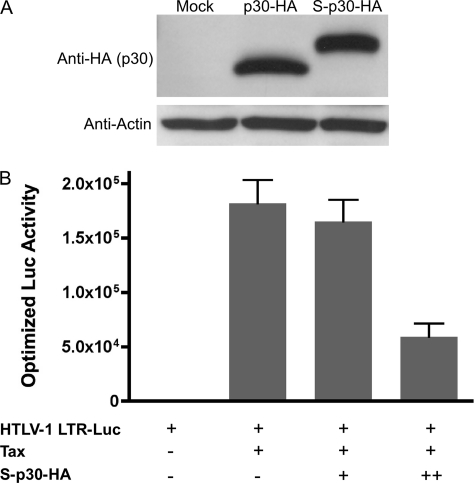
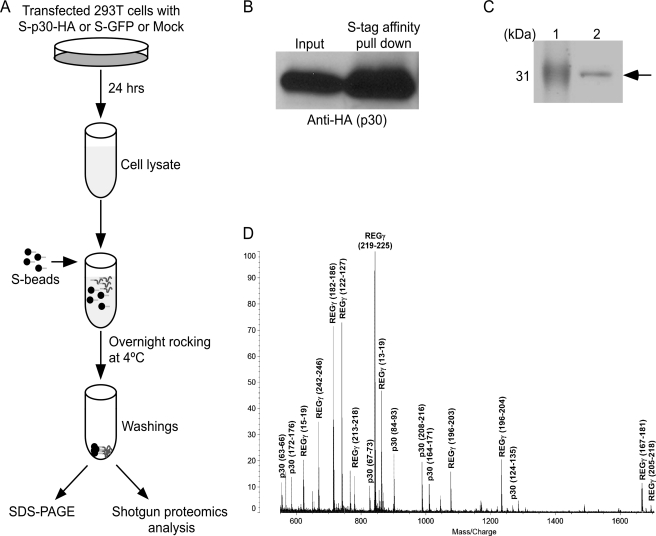
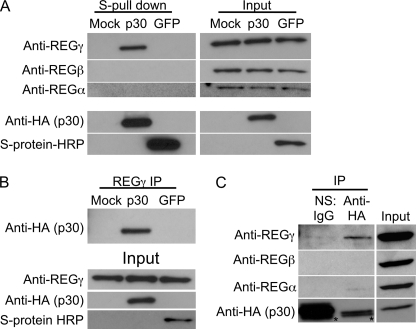
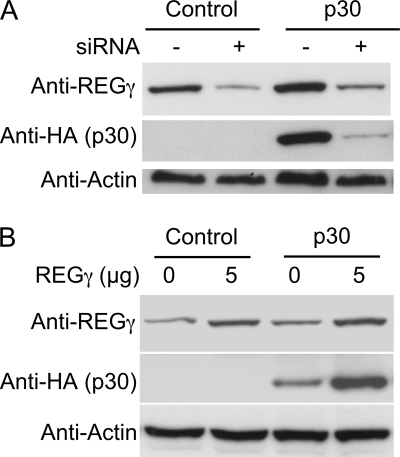
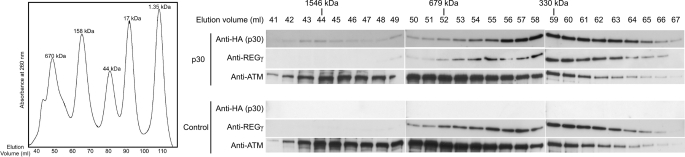
Human T-lymphotropic virus type 1 (HTLV-1) is a causative agent of adult T cell leukemia/lymphoma and a variety of inflammatory disorders. HTLV-1 encodes a nuclear localizing protein, p30, that selectively alters viral and cellular gene expression, activates G(2)-M cell cycle checkpoints, and is essential for viral spread. Here, we used immunoprecipitation and affinity pulldown of ectopically expressed p30 coupled with mass spectrometry to identify cellular binding partners of p30. Our data indicate that p30 specifically binds to cellular ATM (ataxia telangiectasia mutated) and REGγ (a nuclear 20 S proteasome activator). Under conditions of genotoxic stress, p30 expression was associated with reduced levels of ATM and increased cell survival. Knockdown or overexpression of REGγ paralleled p30 expression, suggesting an unexpected enhancement of p30 expression in the presence of REGγ. Finally, size exclusion chromatography revealed the presence of p30 in a high molecular mass complex along with ATM and REGγ. On the basis of our findings, we propose that HTLV-1 p30 interacts with ATM and REGγ to increase viral spread by facilitating cell survival.


Figures

FIGURE 1.
FIGURE 1.
p30 expression enhances cell survival under conditions of genotoxic stress. Cell survival was tested in 293T and Jurkat T cells transduced with lentivirus vectors to stably express p30 or mock (GFP vector) prior to exposure to 10-Gy irradiation. Cell survival was monitored using CellTiter 96 AQueous One solution reagent according to the manufacturer's instructions. Data points represent the mean absorbance values of six independent trials plotted over time. Statistical differences were compared using analysis of variance. In 293T cells, statistically significant (asterisk) higher cell survival was noted in the presence of p30 compared with the control (GFP) at day 3 (p ≤ 0.0004), at the time the cells reached confluence. In Jurkat T cells, statistically significant (asterisk) higher cell survival was observed in the presence of p30 compared with the control (GFP) at days 3, 4, and 5 (p ≤ 0.0044, 0.0003, and 0.0185, respectively).
FIGURE 2.
FIGURE 2.
p30 binds to ATM and modulates the levels of ATM after genotoxic stress. A, 293T cells were transduced with lentivirus vectors to stably express p30 or mock (GFP vector) prior to exposure to 10-Gy irradiation and were allowed to recover for different times as indicated. Cell lysates were prepared at defined time points and tested by immunoblotting for pATM, ATM, p30-HA, and γH2AX. Equal protein loading was confirmed by testing cell lysates for amounts of β-actin. Base amounts of each evaluated protein were visualized from cells not subjected to DNA damage (denoted by ø). Data represent a minimum of three independent trials. B, cell lysates from Jurkat T cells transduced with lentivirus vectors to stably express p30 or mock (GFP vector) prior to exposure to 10-Gy irradiation were immunoprecipitated (IP) using normal IgG (normal serum (NS)) or rabbit anti-HA antibodies and probed with mouse anti-ATM and anti-ATR monoclonal antibodies. The reverse immunoprecipitation was performed by immunoprecipitation of cell lysates of Jurkat T cells stably expressing p30-HA with normal IgG or rabbit anti-ATM antibody and probed with mouse anti-HA monoclonal antibody. Data represent a minimum of three independent trials for each immunoprecipitation assay. IP, immunoprecipitation.
FIGURE 3.
FIGURE 3.
Expression, S-Tag affinity purification, and function of S-p30-HA. A, 293T cells were transfected with pME-p30-HA or pTriEx4-Neo-S-p30-HA expression plasmid. p30 was detected using mouse anti-HA monoclonal antibody after resolving cell lysates by 4–20% gradient SDS-PAGE. B, the functional activity of p30 was determined by an HTLV-1 LTR-reporter gene assay as described (28). 293T cells were transfected with a luciferase reporter gene driven by an HTLV-1 LTR-Tax expression plasmid and increasing concentrations of S-p30-HA (1.2 and 2.4 μg). The luciferase (Luc) activity was optimized for transfection efficiency using Renilla luciferase as an internal control. Luciferase activity data represent the means of three independent trials.
FIGURE 4.
FIGURE 4.
Affinity pulldown of p30 and mass spectrometric analysis of interacting proteins. A, schematic of p30 purification using the S-Tag pulldown approach coupled with mass spectrometric analysis. 293T cell lysates were prepared 24 h after transfection with expression plasmids (S-p30-HA, mock, or S-GFP). Each cell lysate was incubated overnight with S-beads at 4 °C. To minimize nonspecific protein binding, beads were washed prior to shotgun proteomics or SDS-PAGE separation. B, S-Tag affinity purification of p30 using S-beads resulted in enrichment of p30 as detected by immunoblotting. C, the proteins from the beads were denatured by boiling in SDS loading dye in the presence of β-mercaptoethanol. The proteins were separated by 14% SDS-PAGE and Coomassie Blue-stained. Lane 1 shows the molecular mass marker, and lane 2 shows the S-Tag affinity-purified p30. The S-p30-HA band indicated by the arrow was excised and subjected to mass spectrometric analysis. D, MALDI-TOF spectrum. The protein band migrating near the 31-kDa marker on SDS-PAGE (indicated by the arrow in C) was cut out and subjected to in-gel proteolysis with trypsin. The resulting peptides were analyzed by a MALDI-TOF AXIMA-CFR instrument. Multiple peptide peaks corresponding to p30 and REGγ proteins have been identified and are indicated. The start and end amino acid positions of peptides are depicted in parentheses. The sequence coverage for p30 and REGγ was 30 and 44%, respectively, enabling unequivocal identification of these proteins.
FIGURE 5.
FIGURE 5.
HTLV-1 p30 specifically interacts with REGγ. A, cell lysates of 293T cells transfected with mock, S-p30-HA, and S-GFP expression plasmids were subjected to S-Tag affinity purification and probed with rabbit anti-REGγ antibody. The specificity of binding was confirmed by probing for REGα and REGβ using rabbit antibodies against each protein. The expression of S-p30-HA and S-GFP was visualized using anti-HA antibody and HRP-conjugated S-protein. B, REGγ was immunoprecipitated (IP) using anti-REGγ antibody from cell lysates of 293T cells transfected with mock, S-p30-HA, or S-GFP and probed with anti-HA antibody for p30. The expression of GFP was confirmed using HRP-conjugated S-protein. C, cell lysate from Jurkat T cells transduced with lentivirus vector expressing p30-HA was immunoprecipitated using normal IgG (normal serum (NS)) or anti-HA antibody and probed with anti-REGα, anti-REGβ, and anti-REGγ antibodies. The membrane was probed with anti-HA antibody to demonstrate the expression of p30. The asterisks indicate the light chain band from the antibodies. Data presented in A–C represent a minimum of three independent trials.
FIGURE 6.
FIGURE 6.
HTLV-1 p30 appears to be stabilized by interaction with REGγ. A, SMARTpool siRNA-mediated knockdown of REGγ in stably transduced 293T cells expressing p30-HA resulted in reduced levels of p30. siRNA against REGγ and nonspecific control siRNA are indicated as + and −, respectively. Immunoblotting for REGα and REGβ indicates specific REGγ knockdown. B, overexpression of REGγ using the REGγ expression plasmid in 293T cells stably expressing p30-HA resulted in increased amounts of p30 detected. In A and B (minimum of two independent trials), β-actin immunoblotting served as a loading control, and 293T cells stably expressing only GFP were used as a control.
FIGURE 7.
FIGURE 7.
p30, REGγ, and ATM co-elute, consistent with a multiprotein complex. Cell lysate of 293T cells with no expression or with stable expression p30-HA was subjected to size exclusion chromatography (representative of two independent trials). Different fractions as indicated were subjected to immunoblotting and probed with anti-HA, anti-REGγ, and anti-ATM antibodies. The molecular mass fractions of the protein peak elution are indicated. The chromatograph of the protein standard with different molecular masses is shown and was used to plot the standard curve to derive molecular masses of relevant fractions.

References

    1. Poiesz B. J., Ruscetti F. W., Gazdar A. F., Bunn P. A., Minna J. D., Gallo R. C. (1980) Proc. Natl. Acad. Sci. U.S.A. 77, 7415–7419 - PMC - PubMed
    1. Yoshida M., Miyoshi I., Hinuma Y. (1982) Proc. Natl. Acad. Sci. U.S.A. 79, 2031–2035 - PMC - PubMed
    1. Yoshida M. (2005) Oncogene 24, 5931–5937 - PubMed
    1. Lairmore M., Franchini G. (2007) in Fields Virology (Knipe D. M. ed) pp. 2071–2105, Wolters Kluwer/Lippincott Williams and Wilkins, Philadelphia, PA
    1. Gonçalves D. U., Proietti F. A., Ribas J. G., Araújo M. G., Pinheiro S. R., Guedes A. C., Carneiro-Proietti A. B. (2010) Clin. Microbiol. Rev. 23, 577–589 - PMC - PubMed

Publication types

MeSH terms