

Effects of low-level α-myosin heavy chain expression on contractile kinetics in porcine myocardium
- PMID: 21217059
- PMCID: PMC3064314
- DOI: 10.1152/ajpheart.00452.2010
Effects of low-level α-myosin heavy chain expression on contractile kinetics in porcine myocardium
Abstract
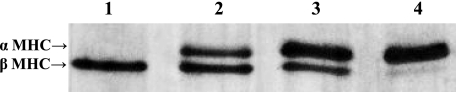
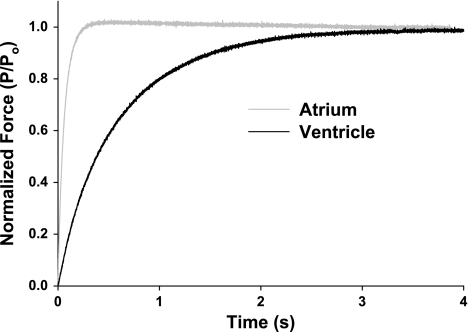
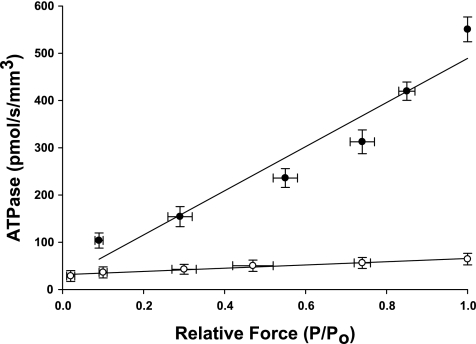
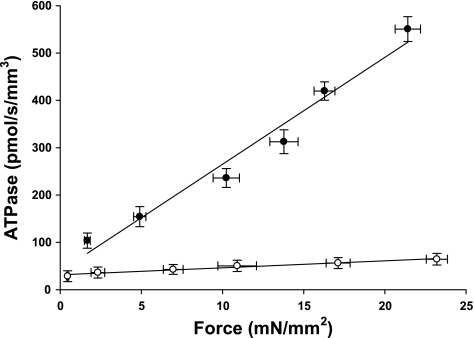
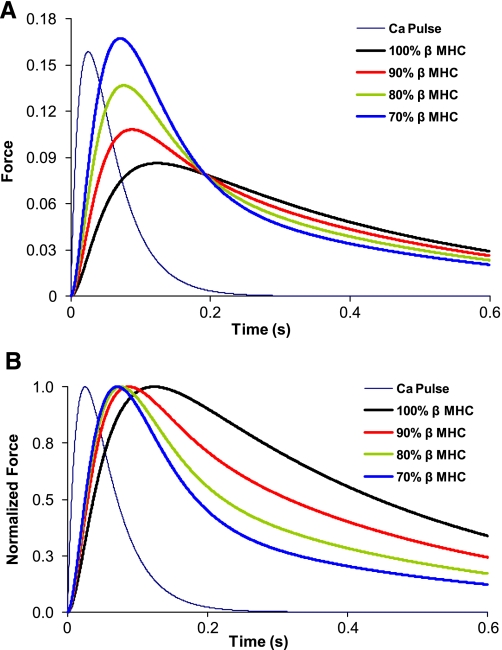
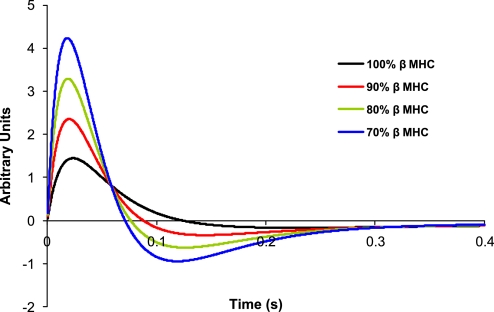
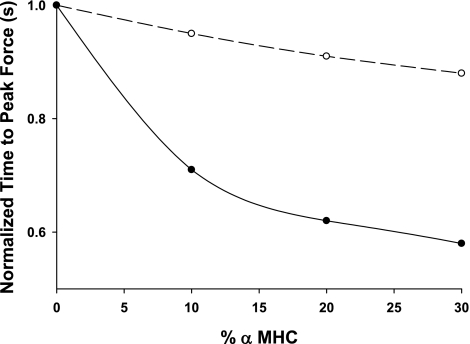
Myosin heavy chain (MHC) isoforms are principal determinants of work capacity in mammalian ventricular myocardium. The ventricles of large mammals including humans normally express ∼10% α-MHC on a predominantly β-MHC background, while in failing human ventricles α-MHC is virtually eliminated, suggesting that low-level α-MHC expression in normal myocardium can accelerate the kinetics of contraction and augment systolic function. To test this hypothesis in a model similar to human myocardium we determined composite rate constants of cross-bridge attachment (f(app)) and detachment (g(app)) in porcine myocardium expressing either 100% α-MHC or 100% β-MHC in order to predict the MHC isoform-specific effect on twitch kinetics. Right atrial (∼100% α-MHC) and left ventricular (∼100% β-MHC) tissue was used to measure myosin ATPase activity, isometric force, and the rate constant of force redevelopment (k(tr)) in solutions of varying Ca(2+) concentration. The rate of ATP utilization and k(tr) were approximately ninefold higher in atrial compared with ventricular myocardium, while tension cost was approximately eightfold greater in atrial myocardium. From these values, we calculated f(app) to be ∼10-fold higher in α- compared with β-MHC, while g(app) was 8-fold higher in α-MHC. Mathematical modeling of an isometric twitch using these rate constants predicts that the expression of 10% α-MHC increases the maximal rate of rise of force (dF/dt(max)) by 92% compared with 0% α-MHC. These results suggest that low-level expression of α-MHC significantly accelerates myocardial twitch kinetics, thereby enhancing systolic function in large mammalian myocardium.
Figures
Similar articles
-
Determination of rate constants for turnover of myosin isoforms in rat myocardium: implications for in vivo contractile kinetics.Am J Physiol Heart Circ Physiol. 2009 Jul;297(1):H247-56. doi: 10.1152/ajpheart.00922.2008. Epub 2009 Apr 24. Am J Physiol Heart Circ Physiol. 2009. PMID: 19395549 Free PMC article.
-
Comparison of elementary steps of the cross-bridge cycle in rat papillary muscle fibers expressing α- and β-myosin heavy chain with sinusoidal analysis.J Muscle Res Cell Motil. 2016 Dec;37(6):203-214. doi: 10.1007/s10974-016-9456-2. Epub 2016 Dec 10. J Muscle Res Cell Motil. 2016. PMID: 27942960
-
Impact of beta-myosin heavy chain isoform expression on cross-bridge cycling kinetics.Am J Physiol Heart Circ Physiol. 2005 Feb;288(2):H896-903. doi: 10.1152/ajpheart.00407.2004. Epub 2004 Oct 7. Am J Physiol Heart Circ Physiol. 2005. PMID: 15471982
-
Thick filament proteins and performance in human heart failure.Heart Fail Rev. 2005 Sep;10(3):187-97. doi: 10.1007/s10741-005-5249-1. Heart Fail Rev. 2005. PMID: 16416042 Review.
-
[Cardiac myosins and myocardial contraction].G Ital Cardiol. 1986 Aug;16(8):680-95. G Ital Cardiol. 1986. PMID: 2947827 Review. Italian.
Cited by
-
Novel insights into sarcomere regulatory systems control of cardiac thin filament activation.J Gen Physiol. 2021 Jul 5;153(7):e202012777. doi: 10.1085/jgp.202012777. J Gen Physiol. 2021. PMID: 33740037 Free PMC article.
-
Comprehensive assessment of chamber-specific and transmural heterogeneity in myofilament protein phosphorylation by top-down mass spectrometry.J Mol Cell Cardiol. 2015 Oct;87:102-12. doi: 10.1016/j.yjmcc.2015.08.007. Epub 2015 Aug 9. J Mol Cell Cardiol. 2015. PMID: 26268593 Free PMC article.
-
Transgenic overexpression of ribonucleotide reductase improves cardiac performance.Proc Natl Acad Sci U S A. 2013 Apr 9;110(15):6187-92. doi: 10.1073/pnas.1220693110. Epub 2013 Mar 25. Proc Natl Acad Sci U S A. 2013. PMID: 23530224 Free PMC article.
-
N-terminal extension in cardiac myosin-binding protein C regulates myofilament binding.J Mol Cell Cardiol. 2018 Dec;125:140-148. doi: 10.1016/j.yjmcc.2018.10.009. Epub 2018 Oct 22. J Mol Cell Cardiol. 2018. PMID: 30359561 Free PMC article.
-
Regulatory light chain mutants linked to heart disease modify the cardiac myosin lever arm.Biochemistry. 2013 Feb 19;52(7):1249-59. doi: 10.1021/bi301500d. Epub 2013 Feb 6. Biochemistry. 2013. PMID: 23343568 Free PMC article.
References
-
- Alpert NR, Mulieri LA. Heat, mechanics, and myosin ATPase in normal and hypertrophied heart muscle. Fed Proc 41: 192–198, 1982 - PubMed
-
- Ashrafian H, Redwood C, Blair E, Watkins H. Hypertrophic cardiomyopathy: a paradigm for myocardial energy depletion. Trends Genet 19: 263–268, 2003 - PubMed
-
- Beuckelmann DJ, Nabauer M, Erdmann E. Intracellular calcium handling in isolated ventricular myocytes from patients with terminal heart failure. Circulation 85: 1046–1055, 1992 - PubMed
-
- Bottinelli R, Canepari M, Cappelli V, Reggiani C. Maximum speed of shortening and ATPase activity in atrial and ventricular myocardia of hyperthyroid rats. Am J Physiol Cell Physiol 269: C785–C790, 1995 - PubMed
-
- Brenner B. The cross-bridge cycle in muscle. Mechanical, biochemical, and structural studies on single skinned rabbit psoas fibers to characterize cross-bridge kinetics in muscle for correlation with the actomyosin-ATPase in solution. Basic Res Cardiol 81, Suppl 1: 1–15, 1986 - PubMed
Publication types
MeSH terms
Substances
Grants and funding
LinkOut - more resources
Full Text Sources
Other Literature Sources
Research Materials
Miscellaneous