. 2010 Dec 31;5(12):e14338.
doi: 10.1371/journal.pone.0014338.

Presymptomatic risk assessment for chronic non-communicable diseases

Affiliations

Presymptomatic risk assessment for chronic non-communicable diseases

Badri Padhukasahasram et al. PLoS One. .

Abstract

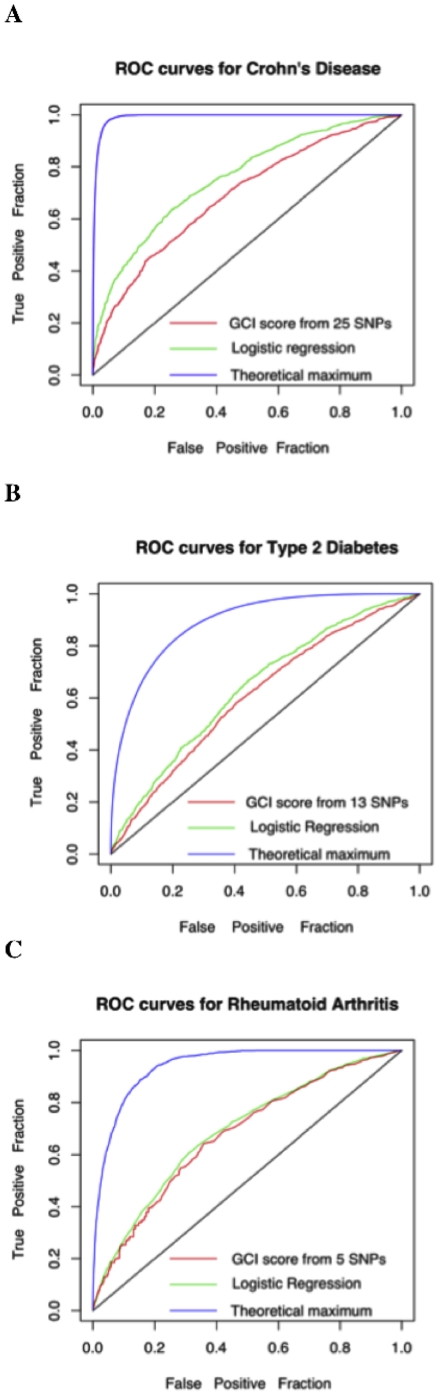
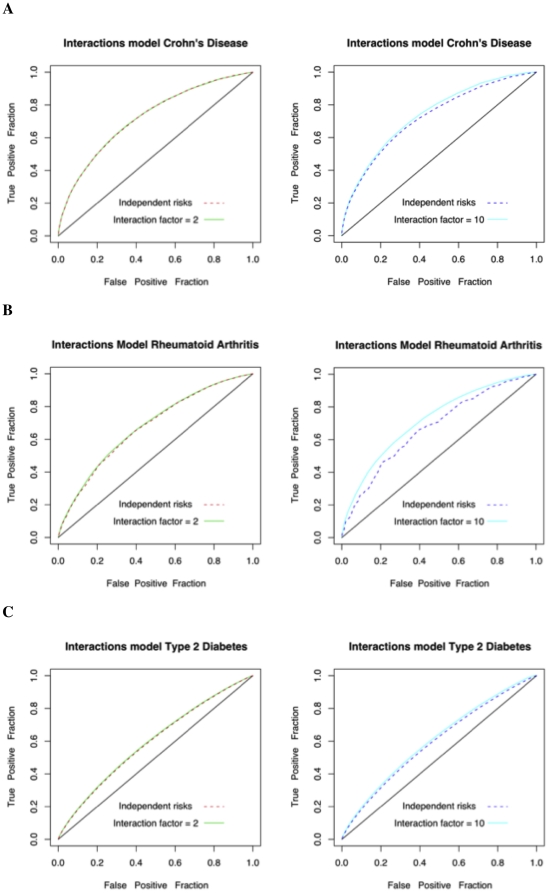
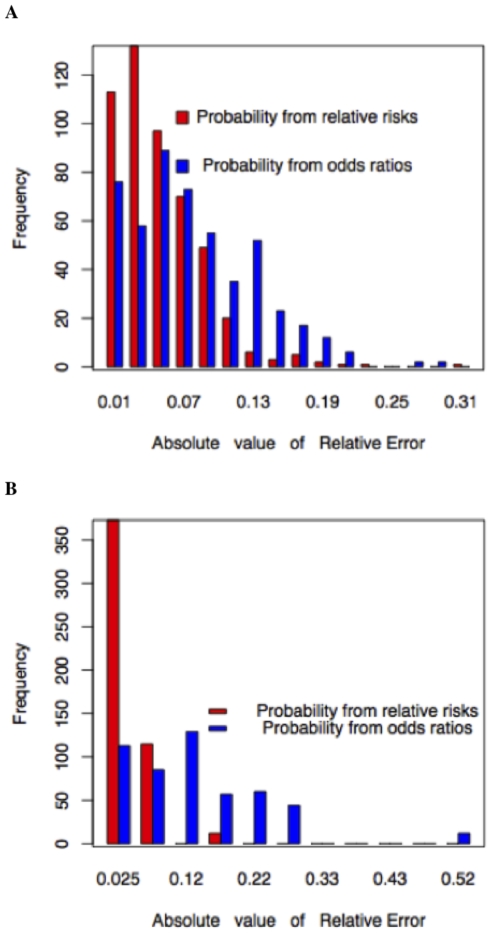
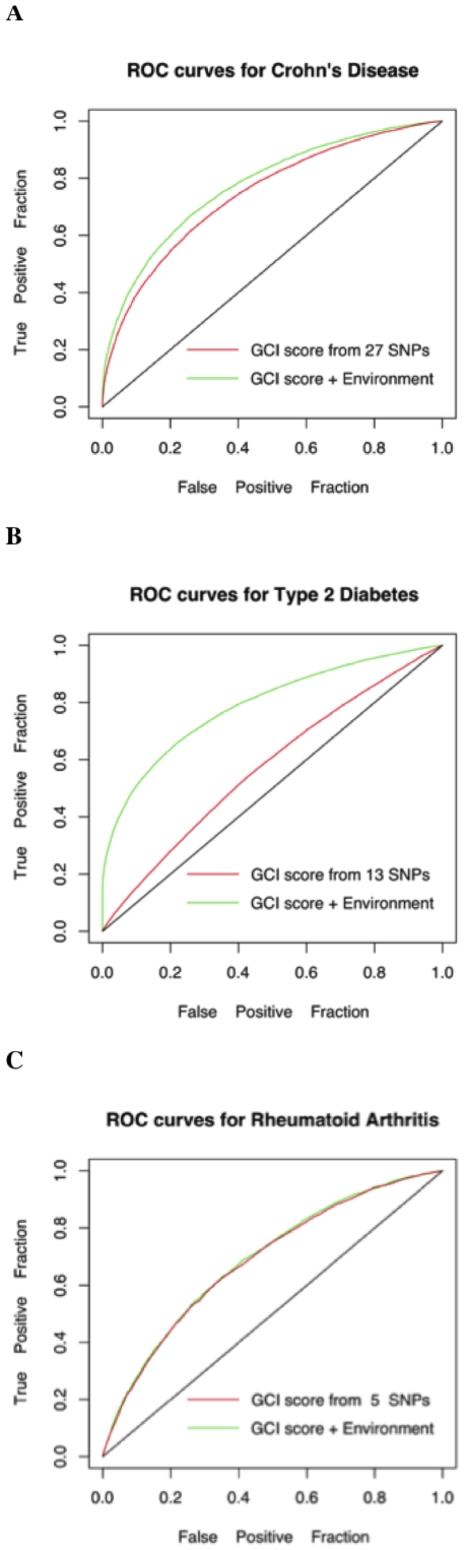
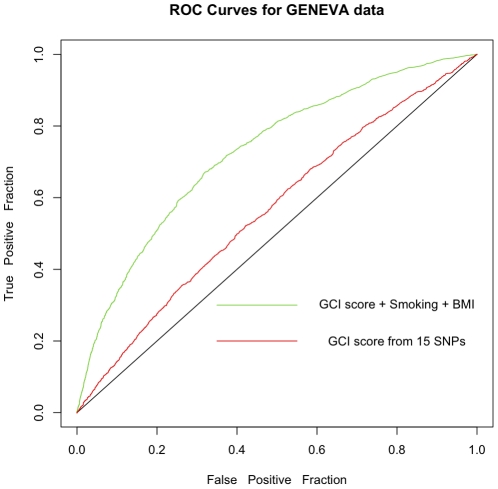
The prevalence of common chronic non-communicable diseases (CNCDs) far overshadows the prevalence of both monogenic and infectious diseases combined. All CNCDs, also called complex genetic diseases, have a heritable genetic component that can be used for pre-symptomatic risk assessment. Common single nucleotide polymorphisms (SNPs) that tag risk haplotypes across the genome currently account for a non-trivial portion of the germ-line genetic risk and we will likely continue to identify the remaining missing heritability in the form of rare variants, copy number variants and epigenetic modifications. Here, we describe a novel measure for calculating the lifetime risk of a disease, called the genetic composite index (GCI), and demonstrate its predictive value as a clinical classifier. The GCI only considers summary statistics of the effects of genetic variation and hence does not require the results of large-scale studies simultaneously assessing multiple risk factors. Combining GCI scores with environmental risk information provides an additional tool for clinical decision-making. The GCI can be populated with heritable risk information of any type, and thus represents a framework for CNCD pre-symptomatic risk assessment that can be populated as additional risk information is identified through next-generation technologies.


Conflict of interest statement

Competing Interests: All the authors were employed at Navigenics Inc when this study was carried out. No other company mentioned in the author affiliations was involved in the study. This is a primary research article and the data used in this study (WTCCC data) was not generated by the company and is available to all qualified researchers. This does not alter the authors' adherence to all the PLoS ONE policies on sharing data and materials.

Figures

Figure 1
Figure 1. ROC curves for the WTCCC dataset.
A. Crohn's Disease. B. Type 2 Diabetes. C. Rheumatoid Arthritis. In each plot, the black line corresponds to random expectation, the blue lines correspond to theoretical expectations (under the two disease models described in Methods) when the genetic variable is known, the red line corresponds to GCI, and the green line corresponds to logistic regression.
Figure 2
Figure 2. ROC curves for models with interactions vs the simple multiplicative model.
A. Crohn's Disease. B. Rheumatoid Arthritis. C. Type 2 Diabetes. In each plot, 1,000 threshold points were used.
Figure 3
Figure 3. Relative errors for the estimated lifetime risk probabilities.
A. Comparison of odds ratios and relative risks for Type 2 Diabetes with lifetime risk of 25% and heritability of 64%. B. Comparison of odds ratios and relative risks for Myocardial Infraction with lifetime risk of 42% and heritability of 57%.
Figure 4
Figure 4. EGCI vs. GCI in simulated data.
A. Effect of known genetic and environmental factors versus known genetic factors alone for Crohn's Disease. The AUCs of the two curves are 0.74 and 0.78. We considered smoking as the environmental variable in addition to the genetic factors. B. Effect of known genetic and environmental factors versus known genetic factors alone for Type 2 Diabetes. The AUCs of the two curves are 0.58 and 0.79 respectively. We considered Body Mass Index, alcohol intake and smoking frequency as the environmental factors for Type 2 Diabetes, in addition to the genetic factors. C. Effect of genetic and environmental factors versus genetic factors alone for Rheumatoid Arthritis. The AUCs of the two curves are 0.685 and 0.690. We considered smoking as the environmental variable in addition to the genetic factors. The relative risks for the environmental variables are provided in Table 4.
Figure 5
Figure 5. ROC curves for the GENEVA dataset.
Effect of genetic (15 SNPs given in Table 6) and environmental factors (BMI, Smoking) versus genetic factors alone for predicting Type 2 Diabetes in 2600 cases and 3000 controls in the GENEVA data. The AUCs of the two curves are 0.727 and 0.565 respectively. The relative risks for BMI and Smoking are given in Table 5.

References

    1. Daar AS, Singer PA, Persad DL, Pramming SK, Matthews DR, et al. Grand Challenges in Chronic Non-Communicable Diseases. Nature. 2007;450:494–496. - PubMed
    1. Lu Q, Elston RC. Using the Optimal Receiver Operating Characteristic Curve to Design a Predictive Genetic Test, Exemplified with Type 2 Diabetes. Am J Hum Genet. 2008;82:641–651. - PMC - PubMed
    1. Kathiresan S, Melander O, Anevski D, Guiducci C, Burtt NP, et al. Polymorphisms associated with cholesterol and risk of cardiovascular events. N Engl J Med. 2008;358:1240–1249. - PubMed
    1. Morrison AC, Bare LA, Chambless LE, Ellis SG, Malloy M, et al. Prediction of Coronary Heart Disease Risk using a Genetic Risk Score: The Atherosclerosis Risk in Communities Study. Am J Epidemiol. 2007;166:28–35. - PubMed
    1. Bentley D, Brown MA, Cardon LR, Caulfield M, Clayton DG, et al. Genome-wide association study of 14,000 cases of seven common diseases and 3,000 shared controls. Wellcome Trust Case Control Consortium, Nature. 2007;447:661–678. - PMC - PubMed

Publication types