

Diagnosis of early stage ovarian cancer by 1H NMR metabonomics of serum explored by use of a microflow NMR probe
- PMID: 21218854
- PMCID: PMC3074977
- DOI: 10.1021/pr101050d
Diagnosis of early stage ovarian cancer by 1H NMR metabonomics of serum explored by use of a microflow NMR probe
Abstract
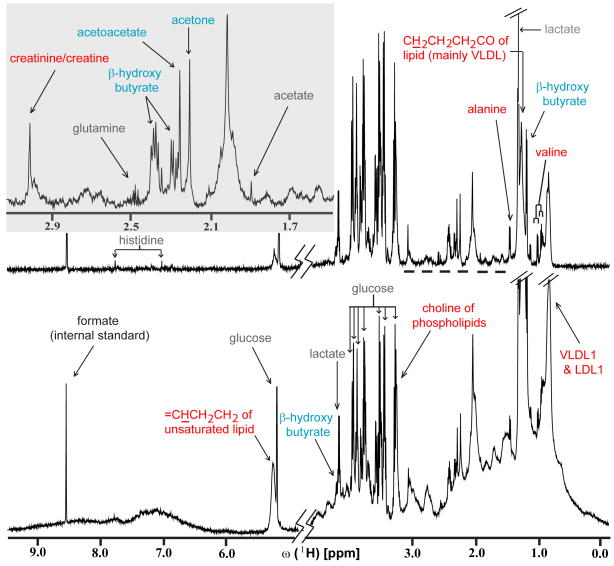
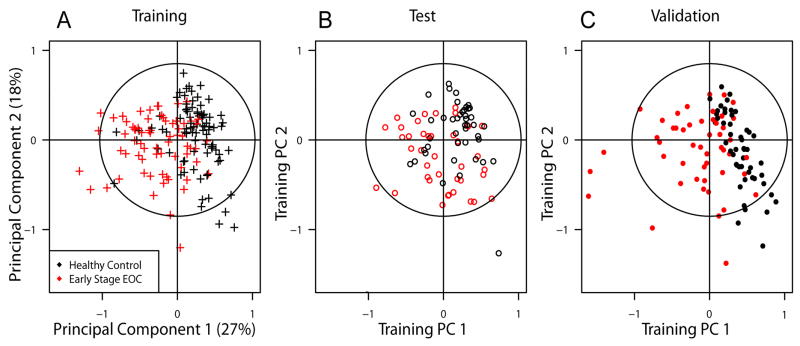
We show that (1)H NMR based metabonomicsof serum allows the diagnosis of early stage I/II epithelial ovarian cancer (EOC) required for successful treatment. Because patient specimens are highly precious, we conducted an exploratory study using a microflow probe requiring only 20 μL of serum. By use of logistic regression on principal components (PCs) of the NMR profiles, we built a 4-variable model for early stage EOC prediction (training set: 69 EOC specimens, 84 healthy controls; test set: 40 EOC, 44 controls) with operating characteristics estimated for the test set at 80% specificity [95% confidence interval (CI): 65-90%], 63% sensitivity (95% CI: 46-77%), and an area under the Receiver Operator Characteristic Curve (AUC) of 0.796. Independent validation (50 EOC, 50 controls) of the model yielded 95% specificity (95% CI: 86-99.5%), 68% sensitivity (95% CI: 53-80%) and an AUC of 0.949. A test on cancer type specificity showed that women diseased with renal cell carcinoma were not incorrectly diagnosed with EOC, indicating that metabonomics bears significant potential for cancer type-specific diagnosis. Our model can potentially be applied for women at high risk for EOC, and our study promises to contribute to developing a screening protocol for the general population.
Figures


References
-
- Armstrong DK, Bundy B, Wenzel L, Huang HQ, Baergen R, Lele S, Copeland LJ, Walker JL, Burger RA. Intraperitoneal cisplatin and paclitaxel in ovarian cancer. N Engl J Med. 2006;354:34–43. - PubMed
-
- Bookman MA, Brady MF, McGuire WP, Harper PG, Alberts DS, Friedlander M, Colombo N, Fowler JM, Argenta PA, De Geest K, Mutch DG, Burger RA, Swart AM, Trimble EL, Accario-Winslow C, Roth LM. Evaluation of new platinum-based treatment regimens in advanced-stage ovarian cancer: a phase III trial of the Gynecologic Cancer Intergroup. J Clin Oncol. 2009;27:1419–1425. - PMC - PubMed
-
- Greenlee RT, Hill-Harmon MB, Murray T, Thun M. Cancer statistics, 2001. CA Cancer J Clin. 2001;51:15–36. - PubMed
-
- Young RC, Walton LA, Ellenberg SS, Homesley HD, Wilbanks GD, Decker DG, Miller A, Park R, Major F., Jr Adjuvant therapy in stage I and stage II epithelial ovarian cancer. Results of two prospective randomized trials. N Engl J Med. 1990;322:1021–1027. - PubMed
-
- Jacobs I. Overview-progress in screening for ovarian cancer. In: Sharp F, Blackett A, Berek J, Bast R, editors. Ovarian Cancer. Vol. 5. Oxford: Isis Medical Media Ltd; 1998. pp. 173–185.
Publication types
MeSH terms
Substances
Grants and funding
LinkOut - more resources
Full Text Sources
Other Literature Sources
Medical
