. 2010 Dec;128(6):3597-13.
doi: 10.1121/1.3500693.

Temporal properties of perceptual calibration to local and broad spectral characteristics of a listening context

Affiliations

Temporal properties of perceptual calibration to local and broad spectral characteristics of a listening context

Joshua M Alexander et al. J Acoust Soc Am. 2010 Dec.

Abstract

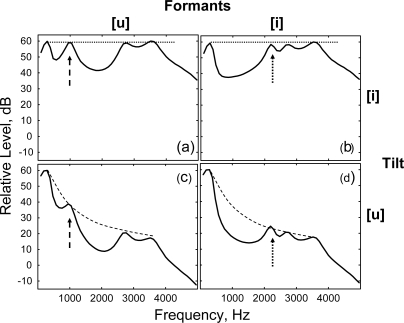
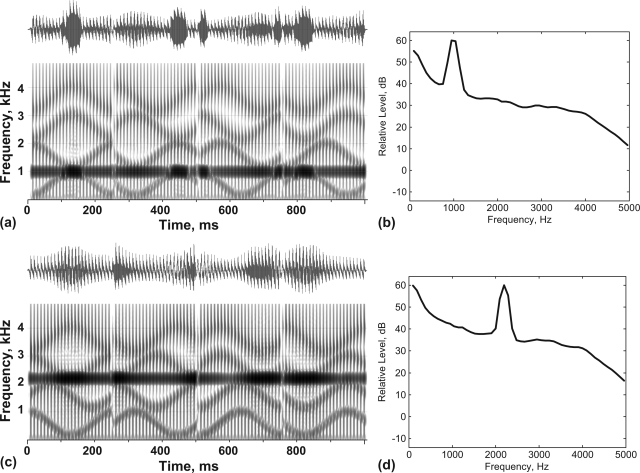
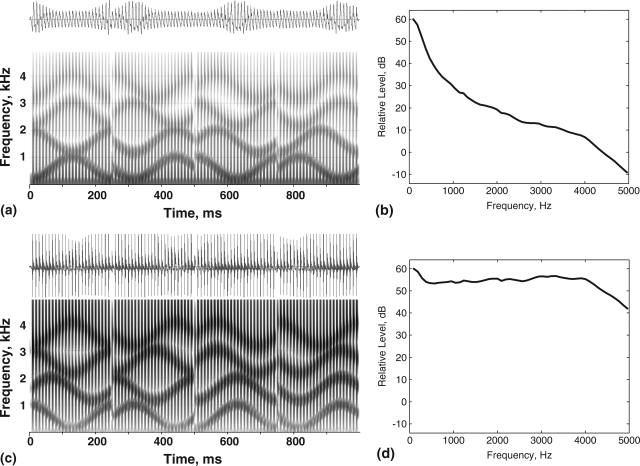
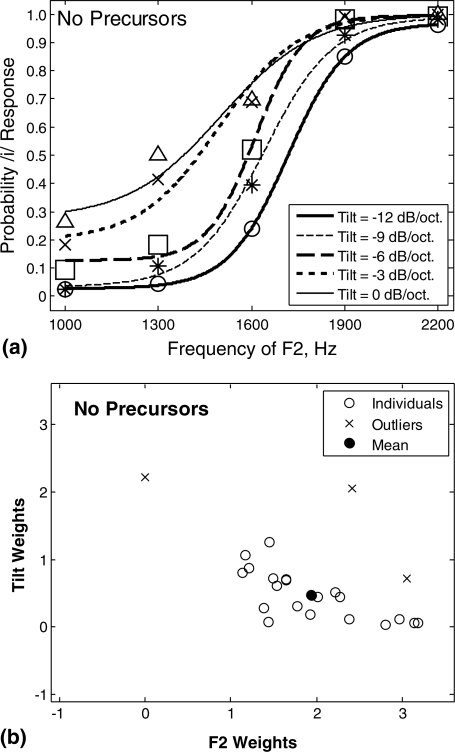
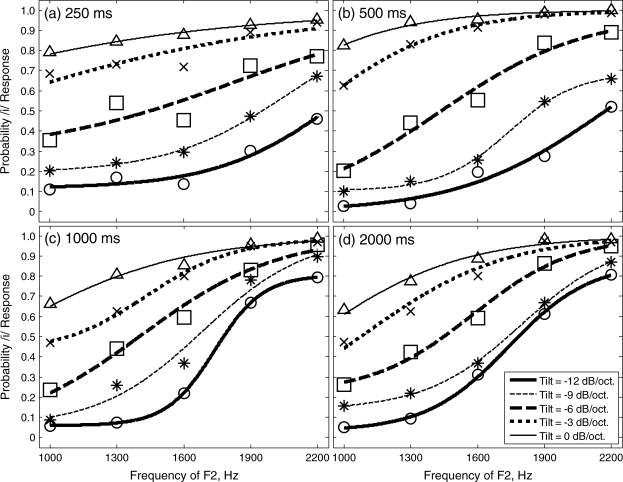
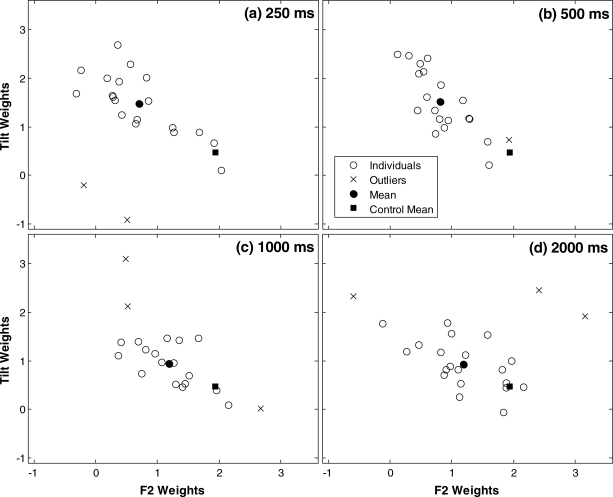
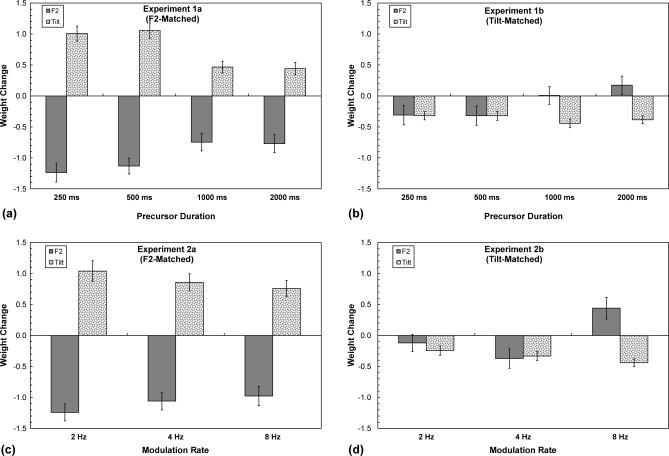
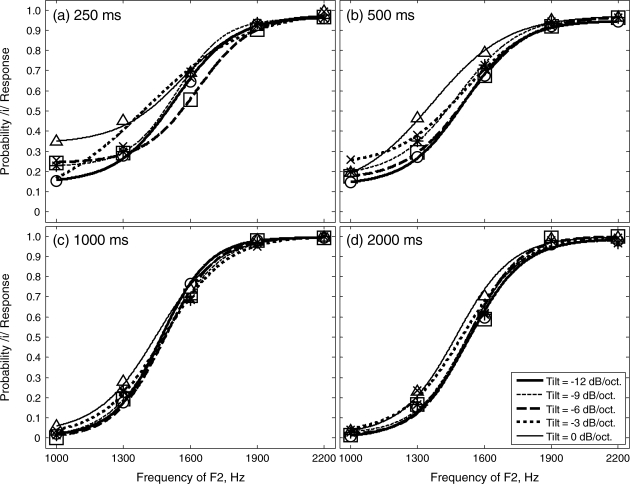
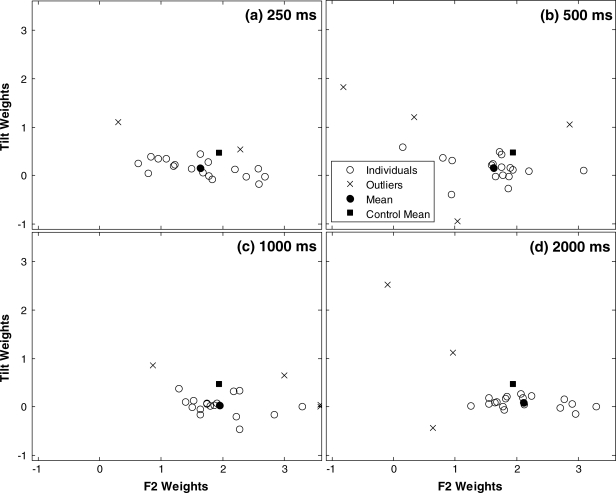
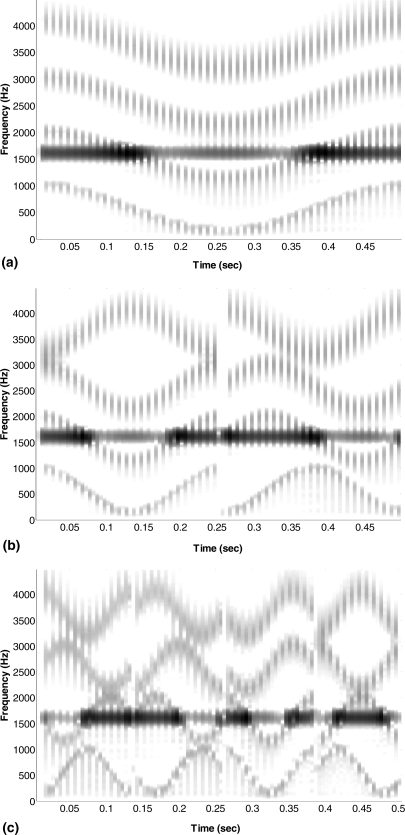
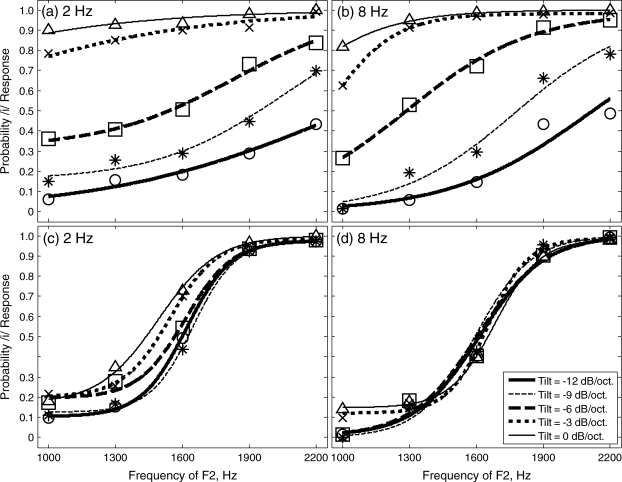
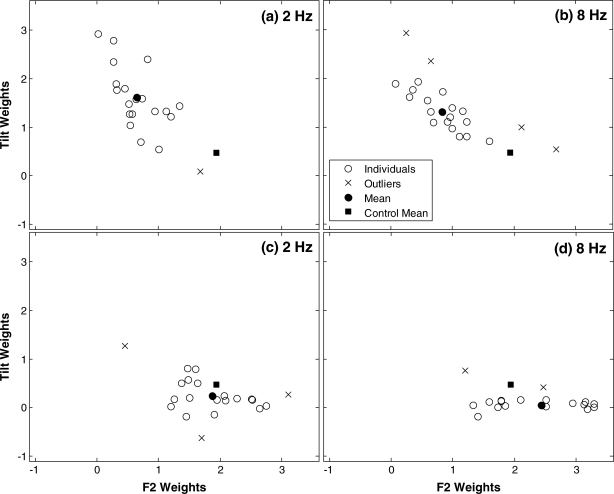
The auditory system calibrates to reliable properties of a listening environment in ways that enhance sensitivity to less predictable (more informative) aspects of sounds. These reliable properties may be spectrally local (e.g., peaks) or global (e.g., gross tilt), but the time course over which the auditory system registers and calibrates to these properties is unknown. Understanding temporal properties of this perceptual calibration is essential for revealing underlying mechanisms that serve to increase sensitivity to changing and informative properties of sounds. Relative influence of the second formant (F(2)) and spectral tilt was measured for identification of /u/ and /i/ following precursor contexts that were harmonic complexes with frequency-modulated resonances. Precursors filtered to match F(2) or tilt of following vowels induced perceptual calibration (diminished influence) to F(2) and tilt, respectively. Calibration to F(2) was greatest for shorter duration precursors (250 ms), which implicates physiologic and/or perceptual mechanisms that are sensitive to onsets. In contrast, calibration to tilt was greatest for precursors with longer durations and higher repetition rates because greater opportunities to sample the spectrum result in more stable estimates of long-term global spectral properties. Possible mechanisms that promote sensitivity to change are discussed.


Figures

Figure 1
Figure 1
Corner stimuli of the target vowel matrix used for all experiments. Stimuli in the left column have the most [u]-like F2 frequency (1000 Hz, dashed arrow) and stimuli in the right column have the most [i]-like F2 frequency (2200 Hz, dotted arrow). Stimuli in the upper row have the most [i]-like tilt spectral tilt (0 dB∕oct, dotted line) and stimuli in the bottom row have the most [u]-like spectral tilt (−12 dB∕oct, dashed line).
Figure 2
Figure 2
Sample 1000-ms precursors with 4-Hz modulation rate for experiment 1A. (a) Time waveform and spectrogram for a sample precursor filtered to have a spectral peak that matched the F2 frequency (1000 Hz) of the following vowel. (b) Spectrum of (a). (c) Time waveform and spectrogram for a sample precursor filtered to have a spectral peak that matched the F2 frequency (2200 Hz) of the following vowel. (d) Spectrum of (c). Note that because the spectral composition of precursors was modulated, additional energy corresponding to target F2 increased and decreased across the duration of precursors.
Figure 3
Figure 3
Sample 1000-ms precursors with 4-Hz modulation rate for experiment 1B. (a) Time waveform and spectrogram for a sample precursor with −12 dB∕oct spectral tilt. (b) Spectrum of (a). (c) Time waveform and spectrogram for a sample precursor with 0 dB∕oct spectral tilt. (d) Spectrum of (c).
Figure 4
Figure 4
(a) Mean identification rates for vowels in isolation (i.e., no precursors) with probability of responding ∕i∕ as a function of F2 frequency plotted separately for each vowel tilt. Circles, asterisks, squares, x’s, and triangles represent mean data for vowel tilts of −12, −9, −6, −3, and 0 dB∕oct, respectively. Maximum likelihood fits of identification rates are displayed for mean data at each vowel tilt as different lines (see legend). (b) Scatter plot of F2 (abscissa) and tilt (ordinate) weights (standardized regression coefficients) for each listener in the control condition plotted as open circles. x’s indicate excluded multivariate outliers and the filled circle is the mean of the remaining data.
Figure 5
Figure 5
Plotted in different panels are mean identification rates for different durations of F2-matched precursors in experiment 1A. See Fig. 4a caption for details.
Figure 6
Figure 6
Scatter plots of individual F2 and tilt weights (open circles) for each duration of F2-matched precursors in experiment 1A. x’s indicate excluded multivariate outliers, the filled circle is the mean of the remaining data, and the filled square is the mean of the control condition from Fig. 4b.
Figure 7
Figure 7
For experiments 1 and 2 (top and bottom panels, respectively), the change in F2 weights (solid bars) and tilt weights (speckled bars) attributed to F2-matched precursors (left panels) and tilt-matched precursors (right panels) are plotted as a function of precursor duration. Error bars represent standard error.
Figure 8
Figure 8
Plotted in different panels are mean identification rates for different durations of tilt-matched precursors in experiment 1B. See Fig. 4a caption for details.
Figure 9
Figure 9
Scatter plots of individual F2 and tilt weights for each duration of tilt-matched precursors in experiment 1B. See Fig. 6 caption for details.
Figure 10
Figure 10
Spectrograms of sample precursors with 2-, 4-, or 8-Hz modulation rates (top, middle, and bottom panels, respectively) for experiment 2A that were filtered to have a spectral peak that matched the F2 frequency (1600 Hz) of the following vowel. Increases in modulation rate increases the number of times the full spectrum is sampled.
Figure 11
Figure 11
Mean identification rates for 2- and 8-Hz modulation rates of F2-matched precursors in experiment 2A are plotted in panels (a) and (b), respectively. 2- and 8-Hz modulation rates of tilt-matched precursors in experiment 2B are plotted in panels (c) and (d), respectively. See Fig. 4a caption for details.
Figure 12
Figure 12
Scatter plots of individual F2 and tilt weights for 2- and 8-Hz modulation rates of F2-matched precursors in experiment 2A are plotted in panels (a) and (b), respectively. 2- and 8-Hz modulation rates of tilt-matched precursors in experiment 2B are plotted in panels (c) and (d), respectively. See Fig. 6 caption for details.

References

    1. Abeles, M., and Goldstein, M. H. (1972). “Responses of single units in the primary auditory cortex of the cat to tones and to tone pairs,” Brain Res. 42, 337–352.10.1016/0006-8993(72)90535-5 - DOI - PubMed
    1. Alexander, J. M., and Kluender, K. R. (2008). “Relativity of spectral tilt change in stop consonant perception,” J. Acoust. Soc. Am. 123, 386–396.10.1121/1.2817617 - DOI - PubMed
    1. Alexander, J. M., and Kluender, K. R. (2009). “Relativity of spectral tilt change in stop consonant perception by hearing-impaired listeners,” J. Speech. Lang. Hear. Res. 52, 653–670.10.1044/1092-4388(2008/08-0038) - DOI - PMC - PubMed
    1. Backus, B. C., and Guinan, J. J., Jr. (2006). “Time-course of the human medial olivocochlear reflex,” J. Acoust. Soc. Am. 119, 2889–2904.10.1121/1.2169918 - DOI - PubMed
    1. Barbour, D. L., and Wang, X. (2003). “Contrast tuning in auditory cortex,” Science 299, 1073–1075.10.1126/science.1080425 - DOI - PMC - PubMed

Publication types