Comparative Study
. 2011 Feb 17;29(9):1745-53.
doi: 10.1016/j.vaccine.2010.12.119. Epub 2011 Jan 8.

Immune responses induced by heat killed Saccharomyces cerevisiae: a vaccine against fungal infection

Affiliations
Comparative Study

Immune responses induced by heat killed Saccharomyces cerevisiae: a vaccine against fungal infection

Min Liu et al. Vaccine. .

Abstract

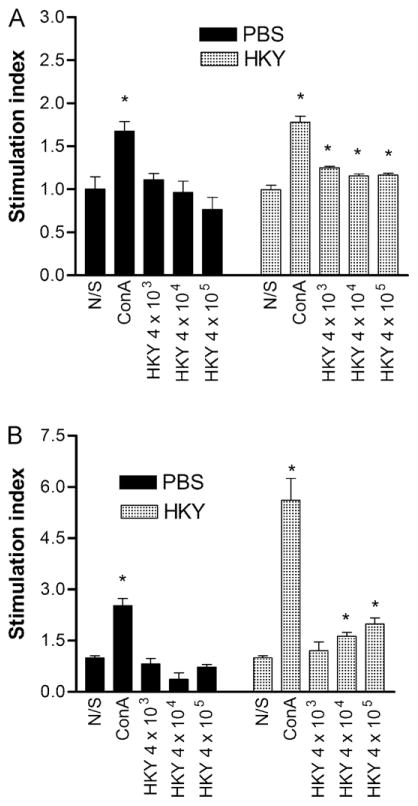
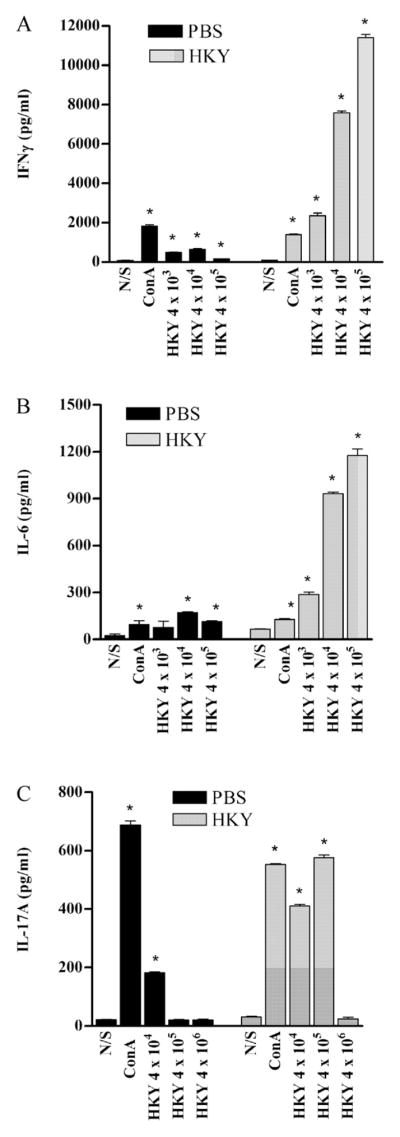
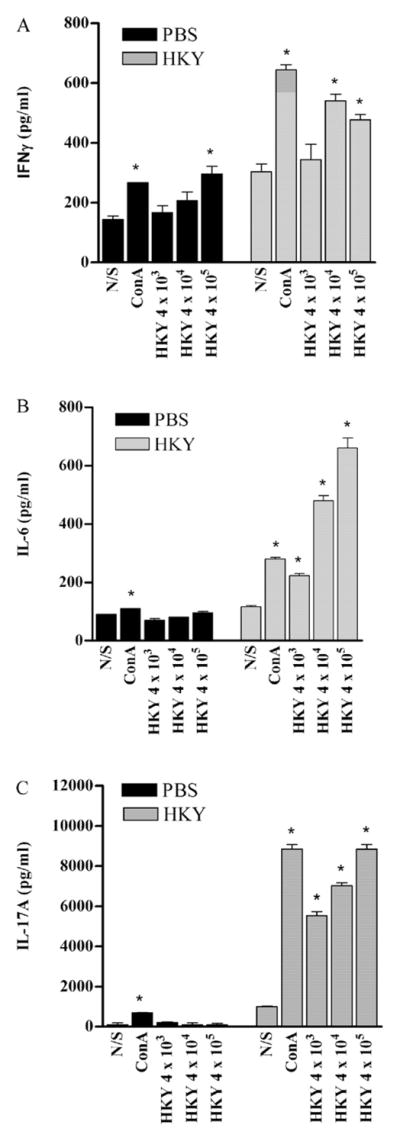
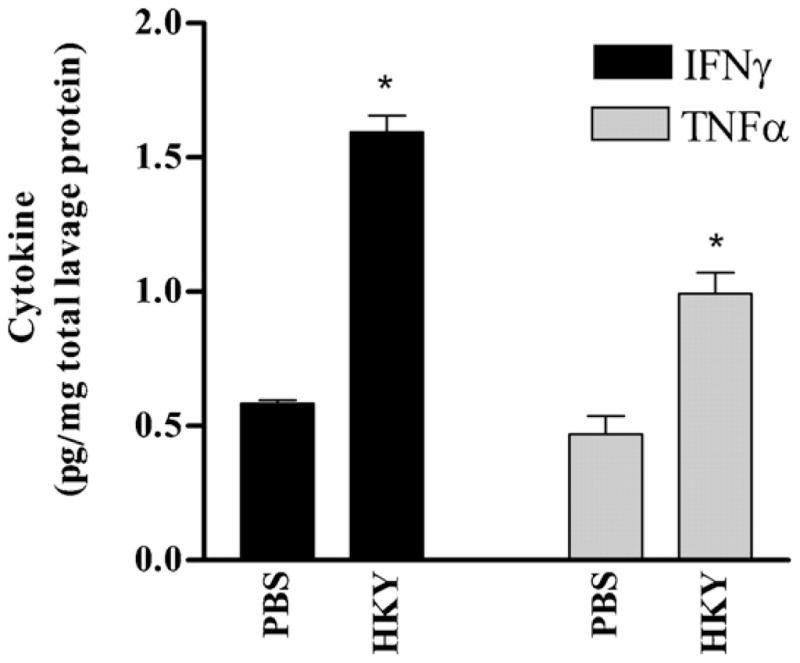
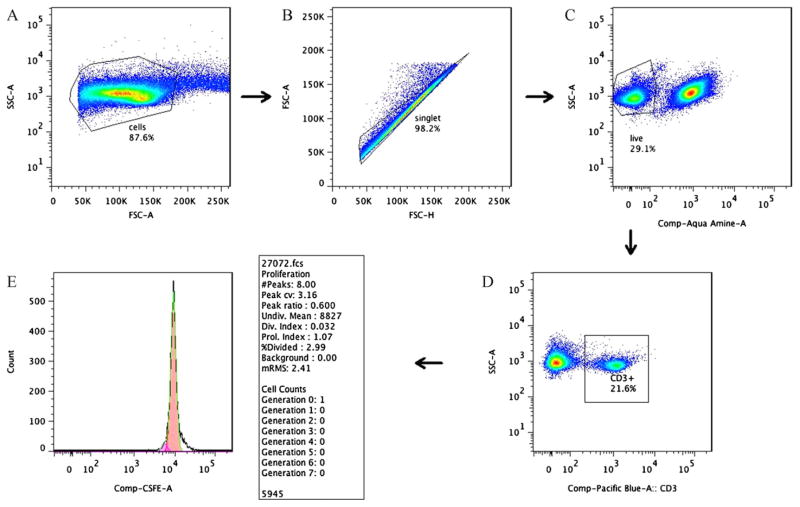
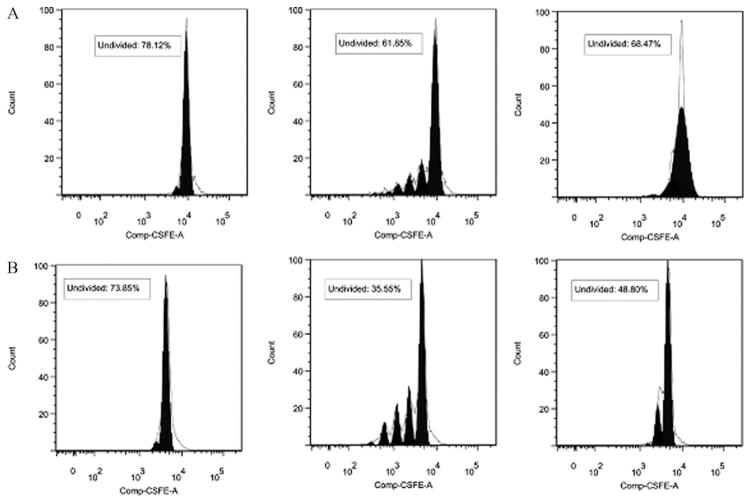
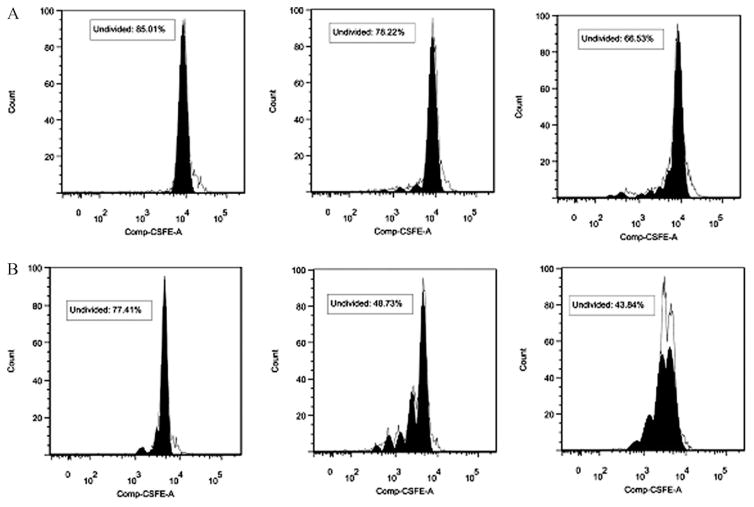
Heat-killed Saccharomyces cerevisiae (HKY) used as a vaccine protects mice against systemic aspergillosis and coccidioidomycosis. Little is known about the immune response induced by HKY vaccination, consequently our goal was to do an analysis of HKY-induced immune responses involved in protection. BALB/c mice were vaccinated subcutaneously 3 times with HKY, a protective reagent, and bronchoalveolar lavage fluid, spleen, lymph nodes, and serum collected 2-5 weeks later. Cultured spleen or lymph node cells were stimulated with HKY. Proliferation of HKY-stimulated spleen or lymph node cells was tested by Alamar Blue reduction and flow cytometry. Cytokines from lymphocyte supernatants and antibody to glycans in serum collected from HKY-vaccinated mice were measured by ELISA. The results show that HKY promoted spleen cell and lymph node cell proliferation from HKY-vaccinated mice but not from PBS-vaccinated control mice (all P<0.05). Cytokine measurement showed HKY significantly promoted IFNγ, IL-6 and IL-17A production by spleen cells and lymph node cells (all P<0.05 and P<0.01, respectively). Cytokine production by HKY-stimulated cells from PBS-vaccinated mice was lower than those from HKY-vaccinated (P<0.05). Cytokines in BAL from HKY-vaccinated were higher, 1.7-fold for IFNγ and 2.1-fold for TNFα, than in BAL from PBS-vaccinated. Flow cytometry of lymphocytes from HKY-vaccinated showed 52% of CD3(+) or 56% of CD8(+) cells exhibited cell division after stimulation with HKY, compared to non-stimulated controls (26 or 23%, respectively) or HKY-stimulated cells from PBS-vaccinated (31 or 34%). HKY also induced antibody against Saccharomyces glucan and mannan with titers 4- or 2-fold, respectively, above that in unvaccinated. Taken together, the results suggested that HKY vaccination induces significant and specific Th1 type cellular immune responses and antibodies to glucan and mannan.


Figures

Fig. 1
Fig. 1
Proliferation of spleen and lymph node cells from PBS-vaccinated and HKY-vaccinated mice stimulated with HKY or ConA (4 μg/ml). (A) Spleen cells were stimulated for 3 d with ConA or HKY doses as indicated. (B) Lymph node cells were stimulated for 7 d with ConA or HKY doses as indicated. Alamar Blue was added to each well for additional 8 h to detect proliferation on the basis of reduction of the Alamar Blue. Each bar represents the mean ± SE. An * indicates P < 0.05 in comparison with the non-stimulated (N/S) control cells. Abbreviations: N/S, non-stimulated; ConA, concanavalin A; HKY, heat-killed yeasts.
Fig. 2
Fig. 2
Cytokines detected in supernatants of spleen cell culture from PBS- and HKY-vaccinated mice, 5 weeks after last dose of vaccination. Cells were stimulated with different doses of HKY or ConA (4 μg/ml) for 3 d and culture supernatant was collected for ELISA. (A) IFNγ production. (B) IL-6 production. (C) IL-17A production. Each bar represents the mean ± SE. An * indicates P < 0.05 in comparison with the non-stimulated (N/S) control cells. Abbreviations: N/S, non-stimulated; ConA, concanavalin A; HKY, heat-killed yeasts.
Fig. 3
Fig. 3
Cytokines detected in supernatants of lymph node cell culture from PBS-vaccinated mice and HKY-vaccinated mice, 2 weeks (IL-6, IL-17A) or 5 weeks (IFNγ) after the last vaccination. Cells were stimulated with different doses of HKY or ConA (4 μg/ml) for 3 d. Culture supernatant was collected for ELISA. (A) IFNγ production. (B) IL-6 production. (C) IL-17A production. Each bar represents the mean ± SE. An * indicates P < 0.05 in comparison with the non-stimulated (N/S) control cells. Abbreviations: N/S, non-stimulated; ConA, concanavalin A; HKY, heat-killed yeasts.
Fig. 4
Fig. 4
IFNγ and TNF-α detected in bronchoalveolar lavage fluid (BALF) from BALB/c mice 2 weeks after the last PBS or HKY vaccination. An * indicates P < 0.05 in comparison with PBS-vaccination.
Fig. 5
Fig. 5
Flow chart illustrated the gating sequence used for cell proliferation analysis by multi-color flow cytometry. (A) Gated total population of all stained mononuclear cells, (B) singlet of gated mononuclear cells, (C) gating of aqua-stained mononuclear cells for live cells (i.e., nonstained), (D) gating of live cells in panel C for CD3+ mononuclear cells, and (E) example of a proliferation histogram of CD3+ control cells showing no cell division (dashed line indicates the model generated by FlowJo 7.2.4 software).
Fig. 6
Fig. 6
Histograms showing proliferation of CD3+ T cells in spleen cells isolated from non-vaccinated (A) and HKY vaccinated (B) mice after in vivo stimulation: non-stimulated control cells (left), ConA (middle) and 4 × 10⁵ cells of HKY (right) for 64 h. CFSE profile from gate illustrates fitted model sum (proliferation model according to FlowJo 7.2.4 software, shown by the clear peaks under the black lines) to determine gates for division number (shown by the filled solid peaks in black). The right black peak in each graph represents generation 0 (undivided) lymphocytes. The number of peaks located on the left side of each generation 0 lymphocytes indicates the division numbers undergone by the lymphocytes.
Fig. 7
Fig. 7
Histograms showing proliferation of CD8+ spleen cells isolated from non-vaccinated (A) and HKY-vaccinated (B) mice after in vivo stimulation with: non-stimulated cells (left), ConA (middle) and 4 × 10⁵ cells of HKY (right) for 64 h. CFSE profile from gate illustrates fitted model sum (proliferation model according to FlowJo 7.2.4 software shown by the clear peaks under the black lines) to determine gates for division number (shown by the filled solid peaks in black). The right black peak in each graph represents generation 0 (undivided) lymphocytes. The number of peaks located on the left side of each generation 0 lymphocytes indicates the division numbers undergone by the lymphocytes.

References

    1. Robbins JB, Schneerson R. Polysaccharide–protein conjugates: a new generation of vaccines. J Infect Dis. 1990;161(5):821–32. - PubMed
    1. Torosantucci A, Bromuro C, Chiani P, De Bernardis F, Berti F, Galli C, et al. A novel glyco-conjugate vaccine against fungal pathogens. J Exp Med. 2005;202(5):597–606. - PMC - PubMed
    1. Bernstein MB, Chakraborty M, Wansley EK, Guo Z, Franzusoff A, Mostbock S, et al. Recombinant Saccharomyces cerevisiae (yeast-CEA) as a potent activator of murine dendritic cells. Vaccine. 2008;26(4):509–21. - PubMed
    1. Remondo C, Cereda V, Mostbock S, Sabzevari H, Franzusoff A, Schlom J, et al. Human dendritic cell maturation and activation by a heat-killed recombinant yeast (Saccharomyces cerevisiae) vector encoding carcinoembryonic antigen. Vaccine. 2009;27(7):987–94. - PMC - PubMed
    1. Capilla J, Clemons KV, Liu M, Levine HB, Stevens DA. Saccharomyces cerevisiae as a vaccine against coccidioidomycosis. Vaccine. 2009;27(27):3662–8. - PubMed

Publication types

MeSH terms