. 2011 Apr;42(1):85-98.
doi: 10.1016/j.nbd.2011.01.008. Epub 2011 Jan 8.

A mouse model of the fragile X premutation: effects on behavior, dendrite morphology, and regional rates of cerebral protein synthesis

Affiliations

A mouse model of the fragile X premutation: effects on behavior, dendrite morphology, and regional rates of cerebral protein synthesis

Mei Qin et al. Neurobiol Dis. 2011 Apr.

Abstract

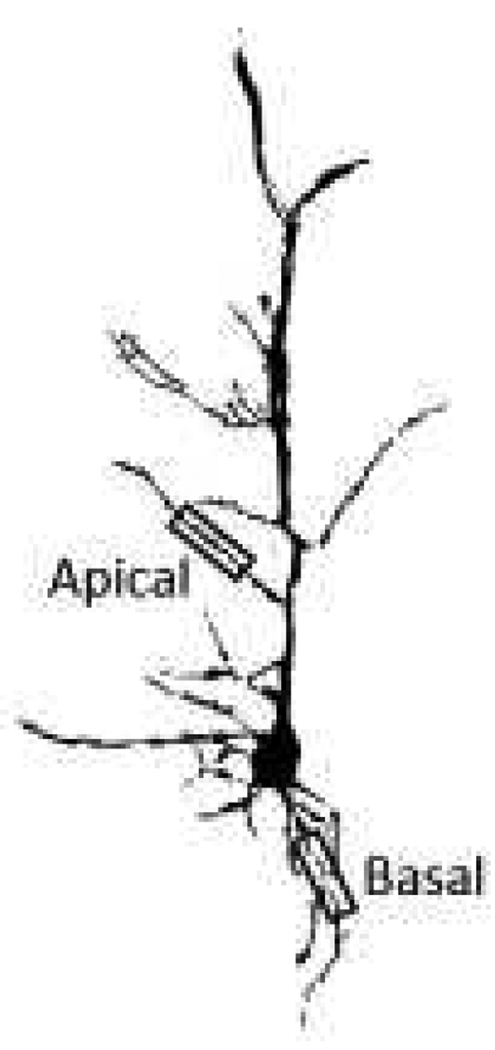
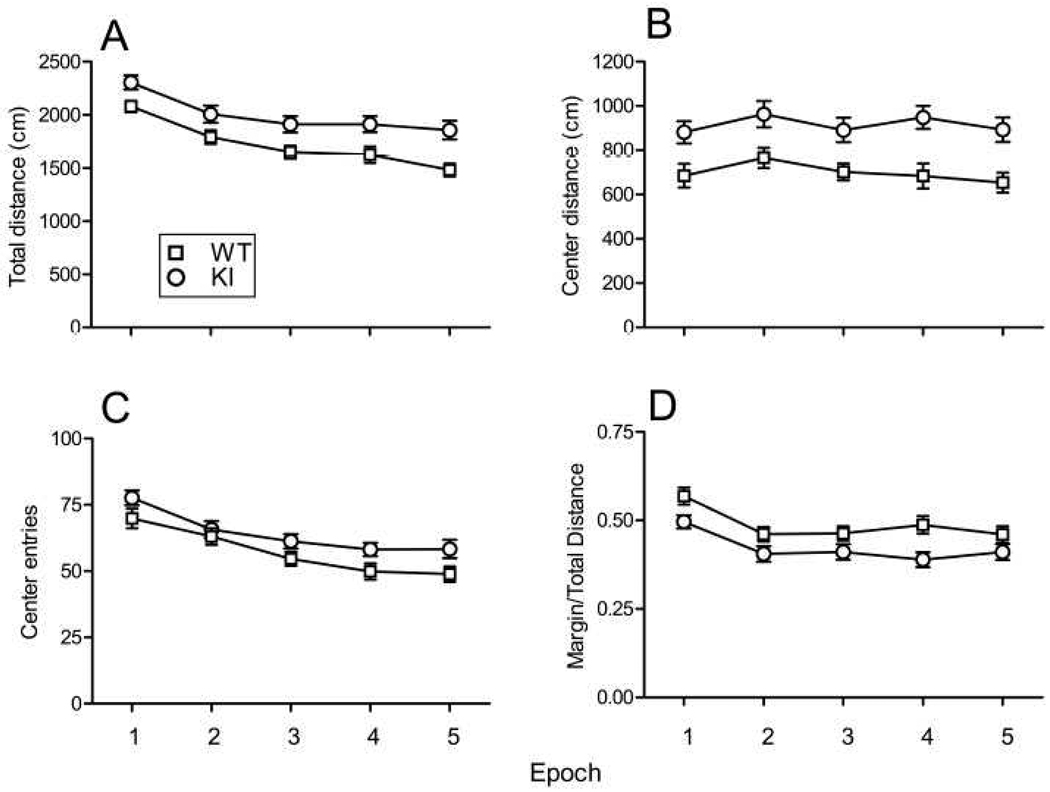
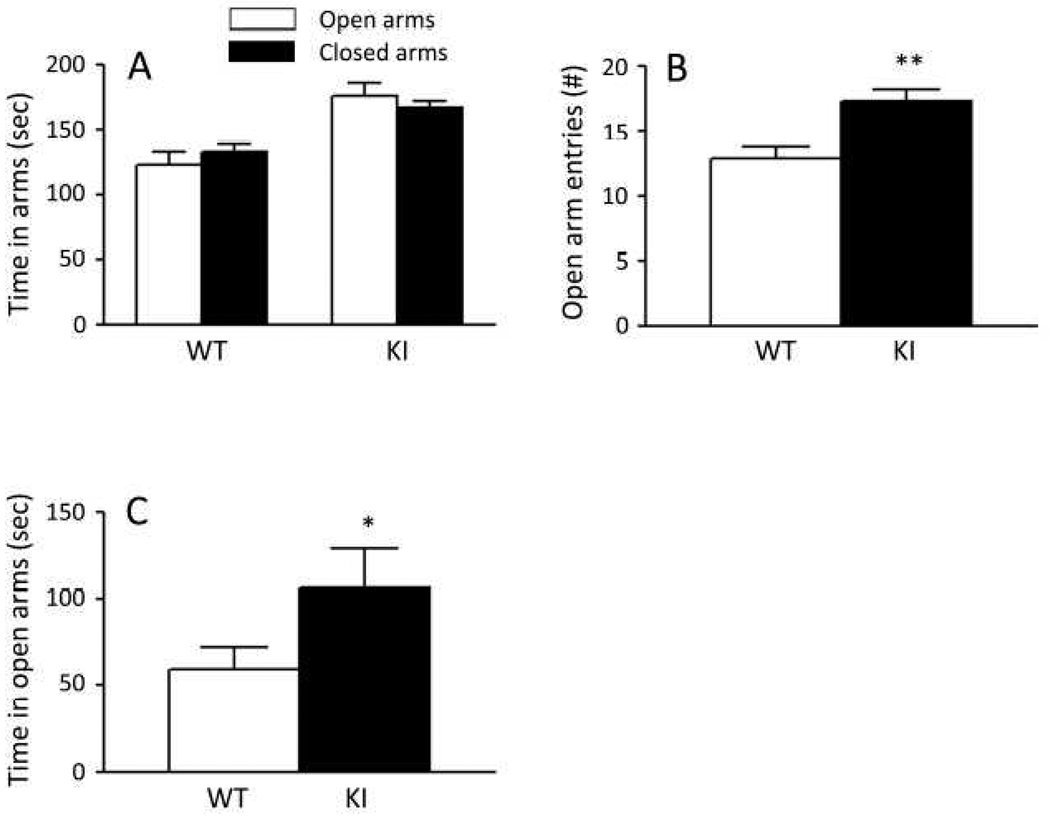
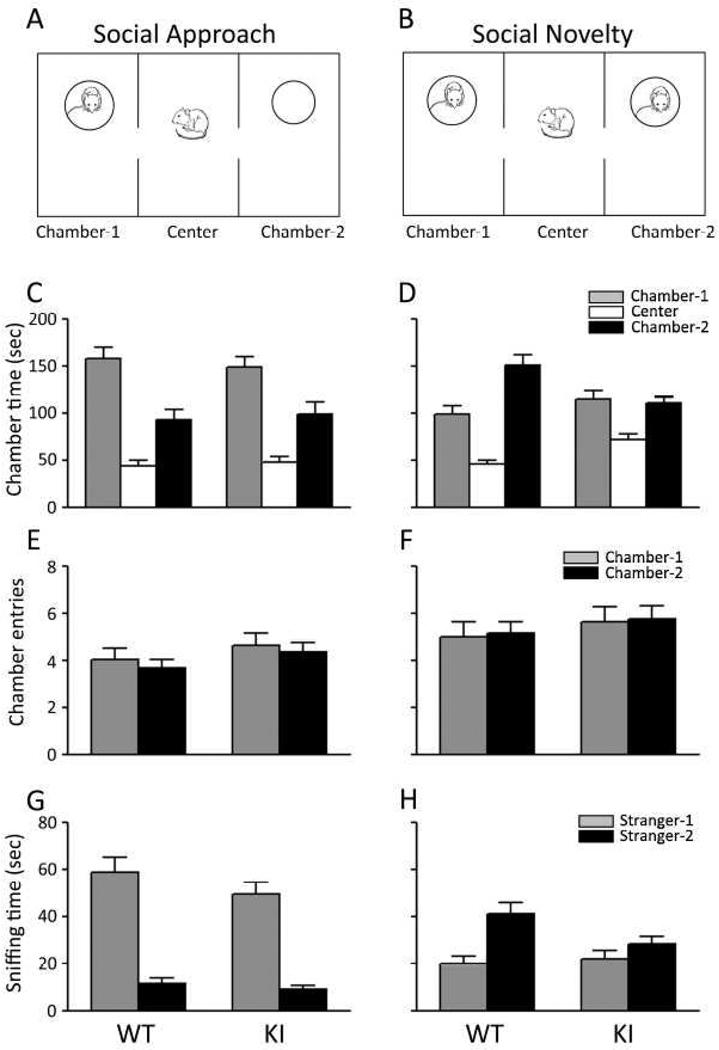
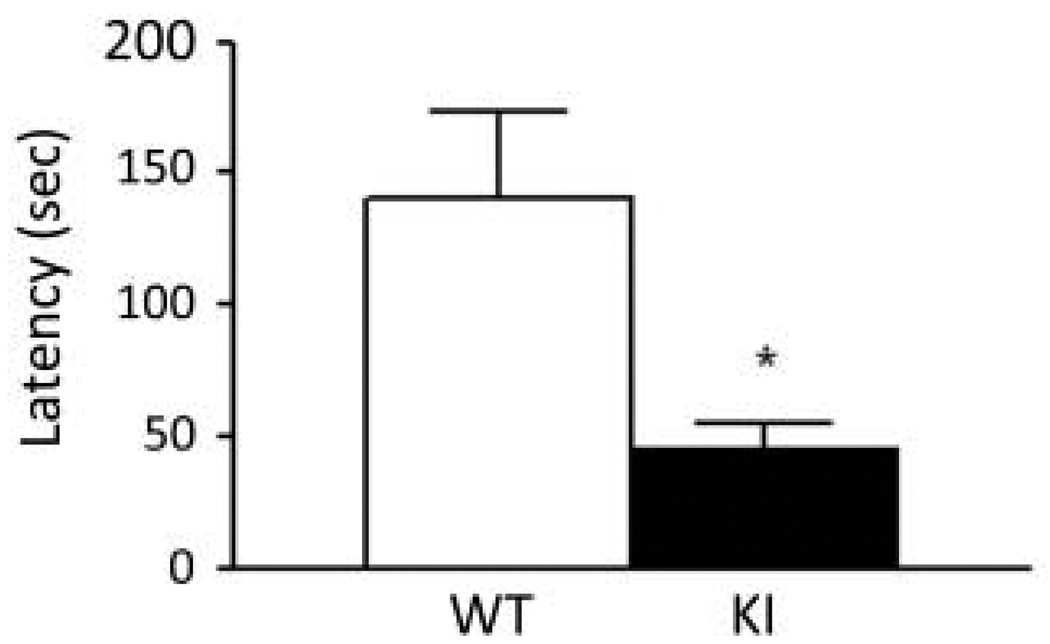
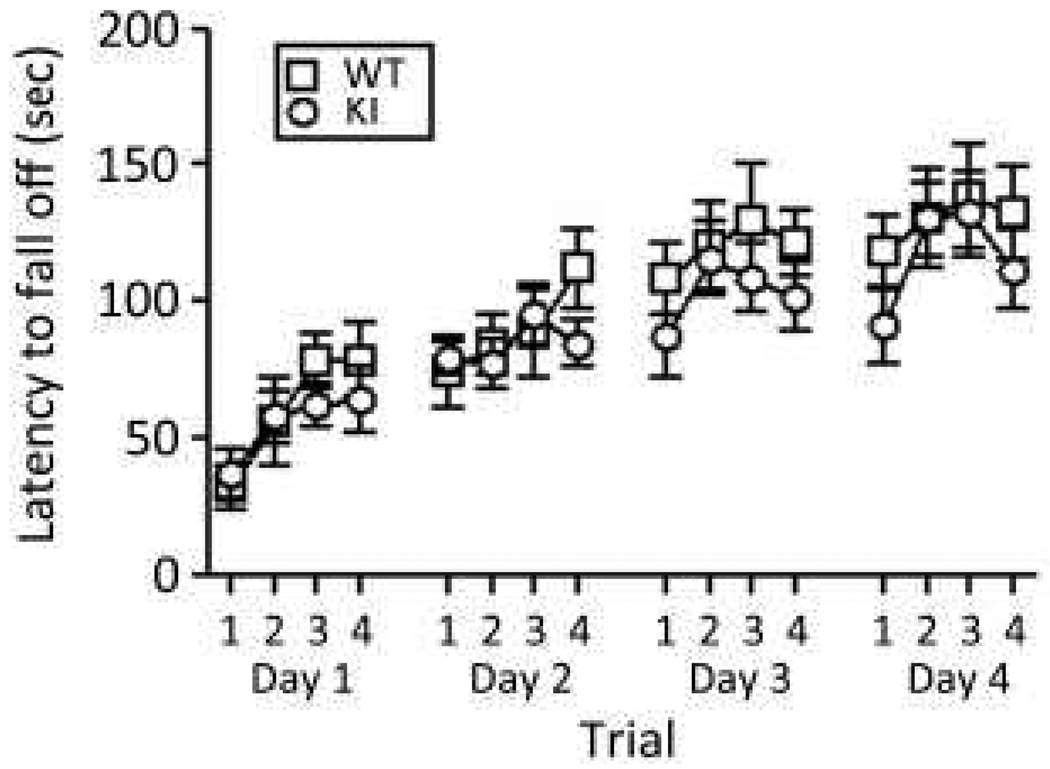
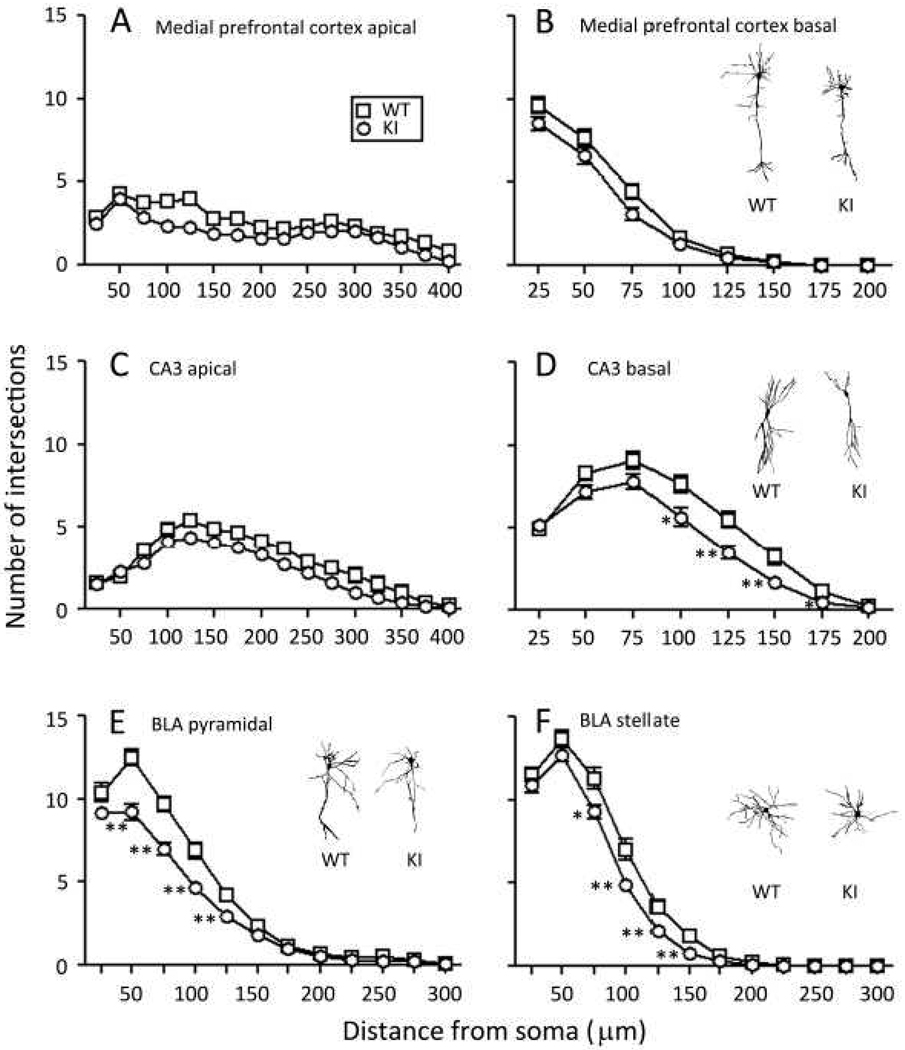
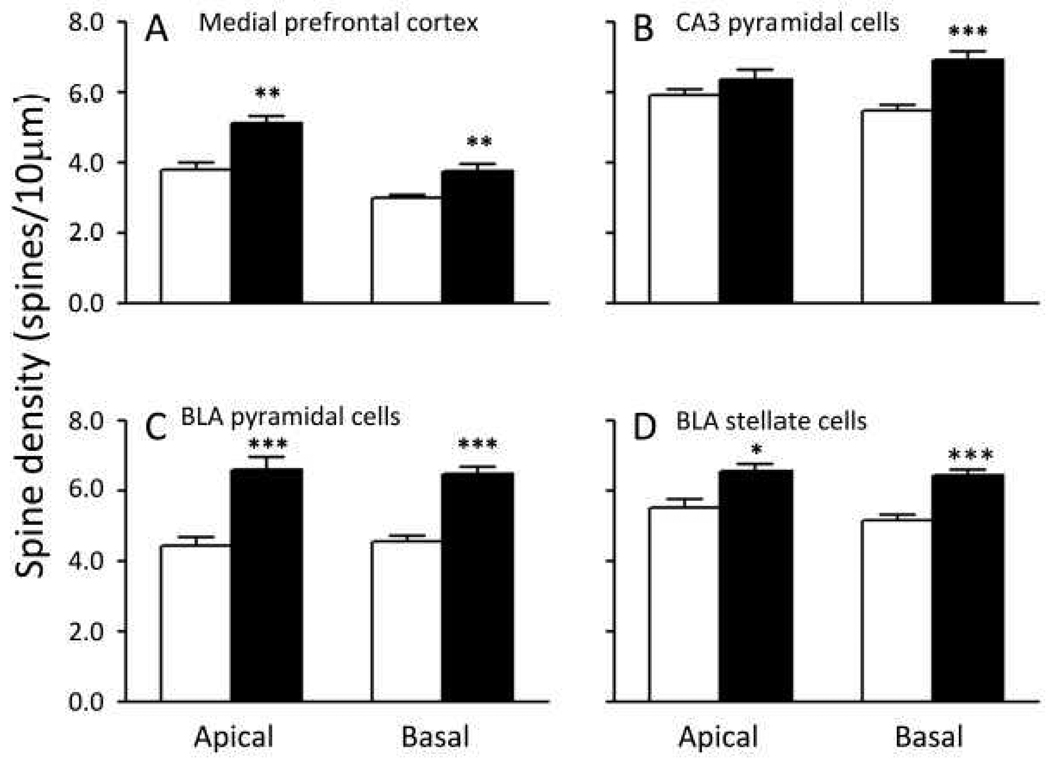
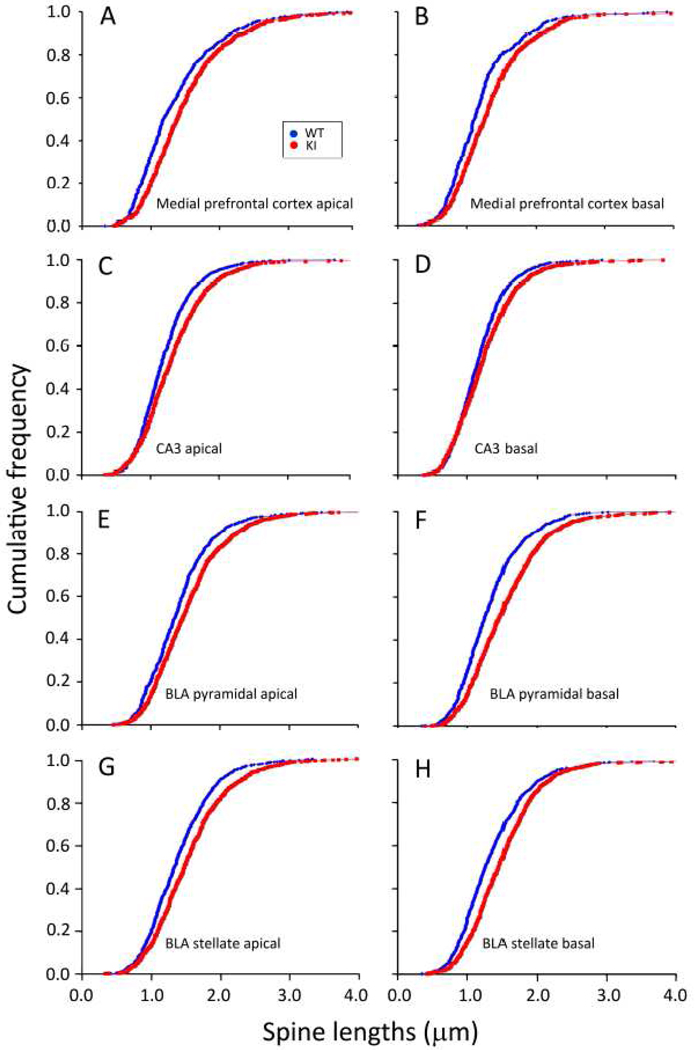
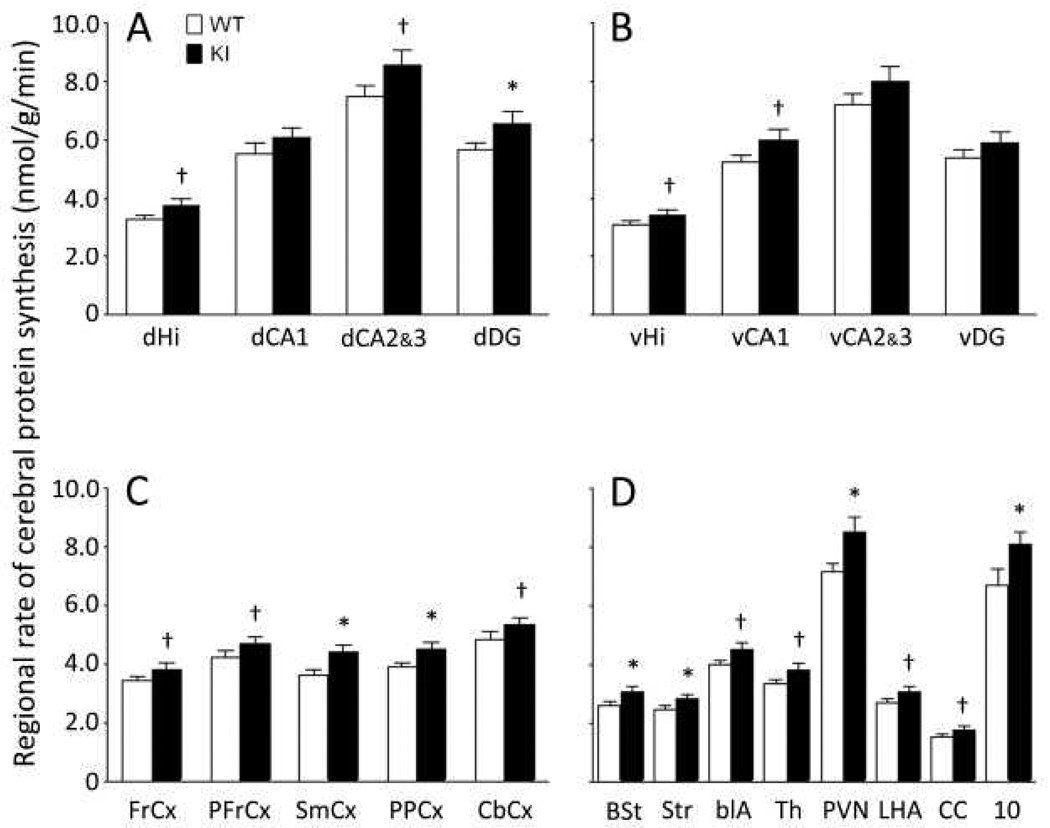
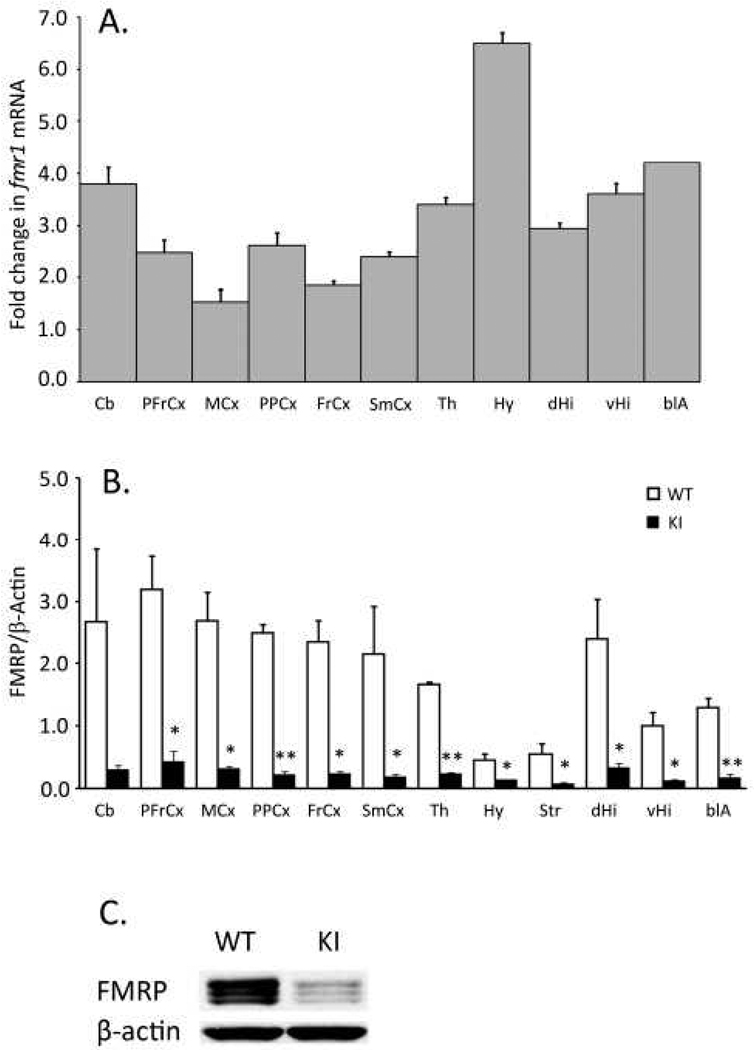
Carriers of FMR1 premutation alleles have 55-200 CGG repeats in the 5' untranslated region of the gene. These individuals are at risk for fragile X associated primary ovarian insufficiency (females) and, in late life, fragile X associated tremor and ataxia syndrome (males, and to a lesser extent, females). Premutation carrier status can also be associated with autism spectrum disorder, attention deficit hyperactivity disorder, and some cognitive deficits. In premutation carriers, FMR1 mRNA levels are often higher than those with normal sized alleles. In contrast, in subjects with full mutation alleles, (>200 repeats) the FMR1 gene is silenced and FMR1 mRNA and its product, FMRP, are absent. We have studied a male knock-in (KI) mouse model of the fragile X premutation (120-140 repeats) during young adulthood. In comparison to wild type, KI mice were hyperactive, exhibited less anxiety in both the open field and the elevated zero maze, were impaired on the passive avoidance test, and showed some subtle deficits on a test of social interaction. Motor learning as assessed by the rotarod test was normal. Dendritic arbors were less complex and spine densities and lengths increased in medial prefrontal cortex, basal lateral amygdala, and hippocampus compared with wild type. Regional rates of cerebral protein synthesis measured in vivo in KI mice were increased. KI mice also had elevated levels of Fmr1 mRNA and decreased levels of FMRP. Our results highlight similarities in phenotype between KI and Fmr1 knockout mice and suggest that the decreased concentration of FMRP contributes to the phenotype in young adult KI mice.


Figures

Fig. 1
Fig. 1
Reconstructed Golgi-stained neuron illustrating the sites on primary basal and secondary apical dendrites sampled for spine analyses.
Fig. 2
Fig. 2
Open-field activity in 27 WT (□) and 27 KI (○) mice. Each point represents the mean ± SEM for each six min epoch. Data were analyzed by means of RM ANOVA with genotype (WT, KI) and epoch as factors and repeated measures on epoch. (A) Total distance moved in the horizontal plane. The epoch × genotype (F(4, 208) = 0.88, NS) interaction was not statistically significant, but main effects of both genotype (F(1,52) = 11.39, P ≤ 0.005) and epoch (F(1,208) = 35.08, P < 0.0001) were. (B) Center distance. Neither the epoch × genotype (F(4, 208) = 0.43, NS) interaction nor the main effect of epoch (F(1,208) = 2.05, P = 0.089) was statistically significant, but the main effect of genotype (F(1,52) = 14.44, P ≤ 0.001) was statistically significant. (C). Number of entries into the center of the field. The epoch × genotype (F(4, 208) = 0.52, NS) interaction was not statistically significant, but main effects of both genotype (F(1,52) = 6.02, P ≤ 0.05) and epoch (F(1,208) = 21.69, P < 0.0001) were. (D). Percent distance moved in the margins of the field. The epoch × genotype (F(4, 208) = 0.82, NS) interaction was not statistically significant, but main effects of both genotype (F(1,52) = 7.53, P ≤ 0.01) and epoch (F(1,208) = 14.83, P < 0.0001) were.
Fig. 3
Fig. 3
Behavior of WT and KI mice in tests of anxiety. Bars represent the means ± SEM. (A). Time spent in the open and closed arms of the EPM in WT (n=25) and KI (n=26) mice. Results were analyzed by RM ANOVA with genotype and arm as factors and repeated measures on arm. Neither the interaction between genotype and arm nor the main effect of genotype were statistically significant, but the main effect of arm (F1,49=15.40, P ≤ 0.001) was. (B). Numbers of entries into the open arms of the EPM for WT (n=25) and KI (n=26) mice were compared by one-tailed Student’s t-test. The difference was statistically significant (P ≤ 0.001, **). (C). Times spent in the open quadrants of the EZM in WT (n=7) and KI (n=7) mice were compared by one-tailed Student’s t-test. The difference was statistically significant (P ≤ 0.05, *).
Fig. 4
Fig. 4
Behavior of WT (n = 20) and KI (n = 20) mice on a test of social interaction. Bars (mean ± SEM) represent the time spent in each chamber (C, D), the number of chamber entries (E, F), time spent sniffing the wire cage in each chamber (G, H). Chamber-1 (or Stranger-1 in G & H) is represented by the grey bar; Chamber-2 (or Stranger-2 in G & H) is represented by the black bars; the center chamber in C & D is represented by the open bars. Results were analyzed by RM ANOVA with genotype (WT, KI), condition (social approach, social novelty), and chamber (Chamber-1, Chamber-2) as factors and repeated measures on condition and chamber. For the time spent in a chamber, the chamber × condition × genotype (F(1,38) = 2.92, P=0.095) and the genotype × chamber (F(1,38) = 1.14, NS) interactions were not statistically significant, but the chamber × condition (F(1, 38) = 15.27, P ≤ 0.001) and condition × genotype (F(1, 38) = 5.53, P ≤ 0.05) interactions were both statistically significant. The pairwise comparison between genotypes was statistically significant for social novelty regardless of chamber (P=0.001). The pairwise comparison between social approach and social novelty regardless of chamber was statistically significant for KI mice (P=0.002). Regardless of genotype we found a statistically significant difference between times spent in chamber-1 and chamber-2 under the social approach (P=0.001) condition. For chamber entries, none of the interactions was statistically significant, and of the factors only the main effect of chamber was statistically significant (F(1, 38) = 12.62, P =0.001). For the time spent sniffing, only the condition × chamber interaction achieved statistical significance (F(1,38) = 77.82, P < 0.001). The chamber × condition × genotype interaction (F(1,38) = 2.65, P=0.11) approached significance. Main effects of both chamber (F(1,38) = 48.00, P ≤ 0.001) and condition (F(1,38) = 5.22, P ≤ 0.05) were statistically significant and the main effect of genotype (F(1,38) = 2.67, P=0.11) approached statistical significance. The pairwise comparison between chambers was statistically significant for both social approach (P < 0.001) and social novelty (P=0.001) regardless of genotype. The pairwise comparison between social approach and social novelty was statistically significant for both Chamber-1 and Chamber-2 regardless of genotype (P < 0.001).
Fig. 5
Fig. 5
Behavior of WT (n=15) and KI (n=17) mice on the passive avoidance test. Bars represent the mean ± SEM latency to enter the dark chamber 24 h after a single training session in which mice received a foot-shock (0.3 mA for 1 s) upon entering the dark chamber. Latencies were significantly different in the two genotypes (P ≤ 0.01, one-tailed Student’s t-test).
Fig. 6
Fig. 6
Behavior of WT (□) (n=11) and KI (○) (n=9) mice on the rotarod test of motor learning. Each point represents the mean ± SEM latency to fall off the rotating rod. Data were analyzed by means of a RM ANOVA with genotype and trial as factors and repeated measures on trial. Neither the interaction between genotype and trial (F15,150 = 0.43, NS) nor the main effect of genotype (F1,150 = 2.17, P=0.17) was statistically significant, but the main effect of trial (F15,150 = 7.33, P ≤ 0.001) was.
Fig. 7
Fig. 7
Dendritic branching in WT (□) and KI (○) mice was assessed by means of Sholl Analyses. Each point represents the mean ± SEM branches on 45 dendrites of each genotype in medial prefrontal cortex and in amygdala and on 50 dendrites of each genotype in hippocampus. Results were analyzed by RM ANOVA with genotype and distance from the soma as factors and repeated measures on distance from the soma. (A). Medial prefrontal cortex, apical dendrites from seven WT and seven KI mice. The interaction between genotype and distance from the soma was not statistically significant, but main effects of both genotype (F1,88 = 26.88, P ≤ 0.001) and distance from the soma (F11,960 = 23.57, P ≤ 0.001) were. (B). Medial prefrontal cortex, basal dendrites, from seven WT and seven KI mice. The interaction between genotype and distance from the soma (F3,263=16.31, P=0.09) approached statistical significance, and main effects of both genotype (F1,88=4.63, P≤0.05) and distance from the soma (F3,263= 357.14, P<0.0001) were statistically significant. (C). Hippocampal CA3, apical dendrites, from seven WT and seven KI mice. The interaction between genotype and distance from the soma was not statistically significant, but main effects of both genotype (F1,98 = 9.19, P ≤ 0.005) and distance from the soma (F4,420=75.57, P≤0.001) were. (D). Hippocampal CA3, basal dendrites, from seven WT and seven KI mice. The interaction between genotype and distance from the soma (F4,372=3.53, P≤0.01) was statistically significant. Statistically significant differences between WT and KI at each distance from the soma were probed by means of Bonferroni t-tests and are indicated on the graph as follows: *, 0.01 ≤ P ≤ 0.05; **, 0.001 ≤ P ≤ 0.01. (E). Basolateral amygdala, pyramidal-like cell dendrites, from nine WT and nine KI mice. The interaction between genotype and distance from the soma (F5,435=8.63, P≤0.001) was statistically significant. Statistically significant differences between WT and KI at each distance from the soma were probed by means of Bonferroni t-tests and are indicated on the graph as described above. (F). Basolateral amygdala, stellate cell dendrites, from nine WT and nine KI mice. The interaction between genotype and distance from the soma (F4,325=3.90, P≤0.005) was statistically significant. Statistically significant differences between WT and KI at each distance from the soma were probed by means of Bonferroni t-tests and are indicated on the graph as described above. Insets in B, D, E, and F are representative of Golgi-impregnated cells from WT and KI mice as follows: medial prefrontal cortex pyramidal cells, hippocampal CA3 pyramidal cells, basal lateral amygdala pyramidal-like cells, and basal lateral amygdale stellate cells, respectively.
Fig. 8
Fig. 8
Spine densities on secondary dendrites in WT (open bars) and KI (filled bars) mice. Bars are the means ± SEM in five mice of each genotype. We measured spine densities on 30 neurons per region on apical and basal dendrites. Differences between genotypes were tested by means of one-tailed Student’s t-tests. Statistically significant differences are indicated on the figure as follows: *, 0.01 ≤ P ≤ 0.05; **, 0.001 ≤ P ≤ 0.01; ***, P < 0.001. (A). Medial prefrontal cortex, apical (left) and basal (right). (B). Hippocampal CA3 pyramidal cells, apical (left and basal (right). (C). Basolateral amygdala pyramidal cells, apical (left) and basal (right). (D). Basolateral amygdala stellate cells, apical (left) and basal (right).
Fig. 9
Fig. 9
Cumulative frequency distributions of dendritic spine lengths in five WT (blue •) and five KI (red •) mice. We measured spine lengths on 30 neurons per region on apical and basal dendrites. Cumulative frequencies were compared by means of Kolmogorov-Smirnov Tests. (A). Medial prefrontal cortex, apical dendrite. Lengths were measured in 570 and 771 spines from five WT and five KI mice, respectively. The difference between the distributions in the two genotypes was statistically significant (P<0.0001). (B). Medial prefrontal cortex, basal dendrite. Lengths were measured in 452 and 565 spines from WT and KI mice, respectively. The difference between the distributions in the two genotypes was statistically significant (P<0.0001). (C). Hippocampal CA3, apical dendrite. Lengths were measured in 882 and 957 spines from WT and KI mice, respectively. The difference between the distributions in the two genotypes was statistically significant (P<0.0001). (D). Hippocampal CA3, basal dendrite. Lengths were measured in 824 and 1040 spines from WT and KI mice, respectively. The difference between the distributions in the two genotypes was statistically significant (P<0.0005). (E). Basolateral amygdala pyramidal cell, apical dendrite. Lengths were measured in 670 and 992 spines from WT and KI mice, respectively. The difference between the distributions in the two genotypes was statistically significant (P<0.0001). (F). Basolateral amygdala pyramidal cell, basal dendrite. Lengths were measured in 694 and 975 spines from WT and KI mice, respectively. The difference between the distributions in the two genotypes was statistically significant (P<0.0001). (G). Basolateral amygdala stellate cell, apical dendrite. Lengths were measured in 830 and 983 spines from WT and KI mice, respectively. The difference between the distributions in the two genotypes was statistically significant (P<0.0001). (H). Basolateral amygdala stellate cell, basal dendrite. Lengths were measured in 797 and 967 spines from WT and KI mice, respectively. The difference between the distributions in the two genotypes was statistically significant (P<0.0005).
Fig. 10
Fig. 10
Regional rates of cerebral protein synthesis in WT (open bars) and KI (filled bars) mice. Bars represent the means ± SEM for eight mice in each group except for the dorsal motor nucleus of the vagus (10) with seven KI mice. Abbreviations are as follows: dHi, dorsal hippocampus; dCA1, CA1 sector of the pyramidal cell layer of dorsal hippocampus; dCA2&3, CA2&3 sectors of the pyramidal cell layer of dorsal hippocampus; dorsal dentate gyrus; vHi, ventral hippocampus; vCA1, CA1 sector of the pyramidal cell layer of ventral hippocampus; vCA2&3, CA2&3 sectors of the pyramidal cell layer of ventral hippocampus; ventral dentate gyrus; FrCx, frontal cortex; PFrCx, medial prefrontal cortex; SmCx, somatosensory cortex; PPCx, posterior parietal cortex; CbCx, cerebellar cortex; BSt, bed nucleus of the stria terminalis; Str, striatum; blA, basolateral amygdala; Th, thalamus; PVN, paraventricular nucleus of the hypothalamus; LHA, lateral hypothalamic area; CC, corpus callosum; 10, dorsal motor nucleus of the vagus. The two groups were compared by means of one-tailed student’s t-tests; *, 0.01 ≤ P ≤ 0.05; †, 0.05 ≤ P ≤ 0.10.
Fig. 11
Fig. 11
Effects of CGG·CCG repeat insertion on Fmr1 mRNA (A) and FMRP (B) in brain regions. Abbreviations are as follows: Cb, cerebellum; PFrCx, medial prefrontal cortex; MCx, primary motor cortex; PPCx, posterior parietal cortex; FrCx, frontal cortex; SmCx, somatosensory cortex; Th, thalamus; Hy, hypothalamus; dHi, dorsal hippocampus; vHi, ventral hippocampus; vCA1, CA1 sector of the pyramidal cell layer of ventral hippocampus; blA, basolateral amygdala. A. Fold changes (± SD) from WT in Fmr1 mRNA were analyzed by quantitative PCR in three mice of each genotype. B. FMRP/β-actin ratios in WT (open bars) and KI (filled bars) mice were determined by Western blotting. Bars are the means ± SEM determined in three mice of each genotype. We used a rabbit polyclonal antibody (ab17722) to FMRP. Differences between genotypes were tested for statistical significance by means of one-tailed student’s t-tests; *, 0.01 ≤ P ≤ 0.05; †, P≤ 0.01. C. Western blot of whole brain extracts from WT and KI mice.
Fig. 12
Fig. 12
Immunohistochemical localization of FMRP in WT (A, C, D, G, I) and KI (B, E, F, H, J) mice in dorsal hippocampus (A, B), cortex (C–F), amygdala (G, H), and cerebellum (I, J). Scalebars in B, E, and H represent 200 µm and in F and J represent 50 µm. Scalebars in B, E, F, H, and J apply to A, C, D, G, and I, respectively.

Similar articles

Cited by

References

    1. Allingham-Hawkins SJ, et al. Fragile X premutation is a significant risk factor for premature ovarian failure: The international collaborative POF in fragile X study - Preliminary data. American Journal of Medical Genetics. 1999;83:322–325. - PMC - PubMed
    1. Aziz M, et al. Clinical features of boys with fragile X premutations and intermediate alleles. American Journal of Medical Genetics Part B-Neuropsychiatric Genetics. 2003;121B:119–127. - PubMed
    1. Birrell JM, Brown VJ. Medial frontal cortex mediates perceptual attentional set shifting in the rat. Journal of Neuroscience. 2000;20:4320–4324. - PMC - PubMed
    1. Bontekoe CJM, et al. Instability of a (CGG)(98) repeat in the Fmr1 promoter. Human Molecular Genetics. 2001;10:1693–1699. - PubMed
    1. Brouwer JR, et al. CGG-repeat length and neuropathological and molecular correlates in a mouse model for fragile X-associated tremor/ataxia syndrome. Journal of Neurochemistry. 2008a;107:1671–1682. - PMC - PubMed

Publication types

MeSH terms

Substances