. 2011 Jan 13;69(1):132-46.
doi: 10.1016/j.neuron.2010.12.008.

The dendritic branch is the preferred integrative unit for protein synthesis-dependent LTP

Affiliations

The dendritic branch is the preferred integrative unit for protein synthesis-dependent LTP

Arvind Govindarajan et al. Neuron. .

Abstract

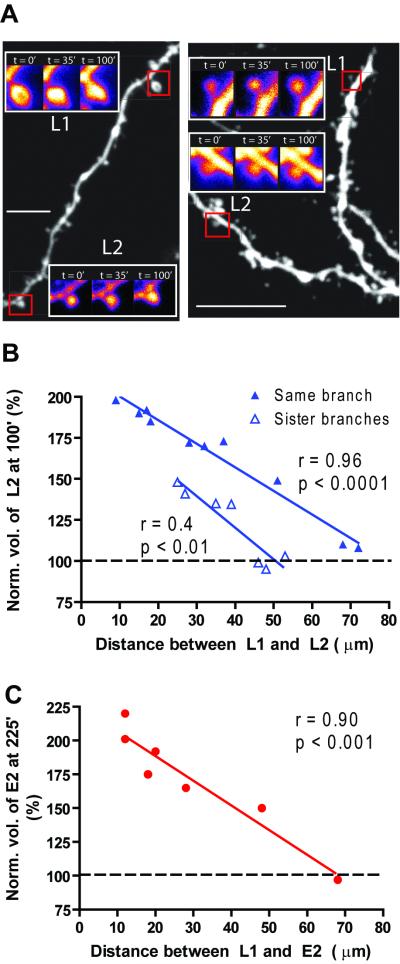
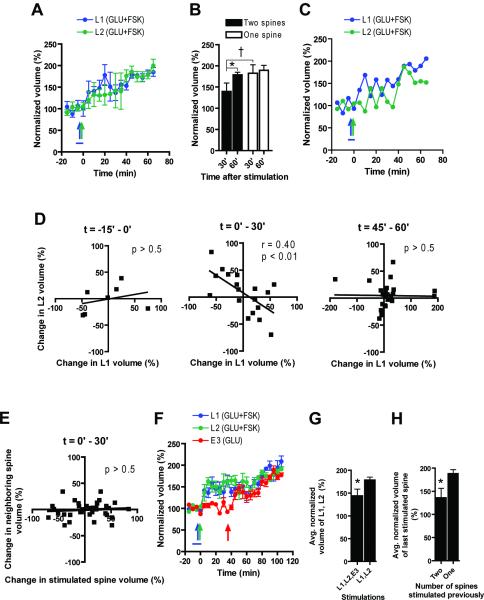
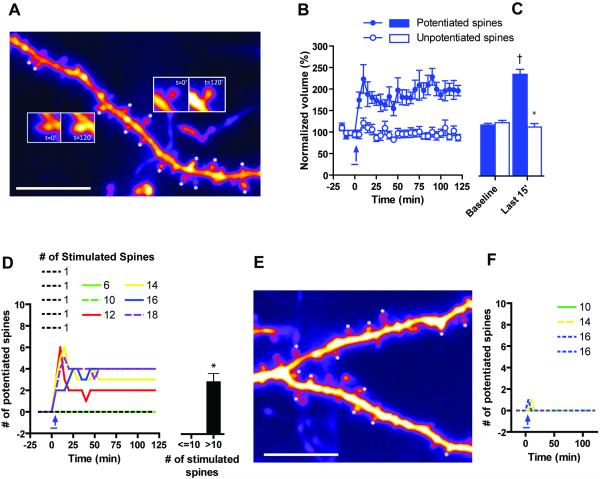
The late-phase of long-term potentiation (L-LTP), the cellular correlate of long-term memory, induced at some synapses facilitates L-LTP expression at other synapses receiving stimulation too weak to induce L-LTP by itself. Using glutamate uncaging and two-photon imaging, we demonstrate that the efficacy of this facilitation decreases with increasing time between stimulations, increasing distance between stimulated spines and with the spines being on different dendritic branches. Paradoxically, stimulated spines compete for L-LTP expression if stimulated too closely together in time. Furthermore, the facilitation is temporally bidirectional but asymmetric. Additionally, L-LTP formation is itself biased toward occurring on spines within a branch. These data support the Clustered Plasticity Hypothesis, which states that such spatial and temporal limits lead to stable engram formation, preferentially at synapses clustered within dendritic branches rather than dispersed throughout the dendritic arbor. Thus, dendritic branches rather than individual synapses are the primary functional units for long-term memory storage.


Figures

Figure 1
Figure 1. L-LTP and E-LTP could be induced at single spines
A) Example of tetanised spine (filled circle), and neighboring spine (open circle) before (t=0') and 80' after GLU+FSK stimulation. B) Pooled data from 4 spines show concomitant increase of spine volume and uEPSC strength of the stimulated, but not neighboring spine. CD) Pooled data from 5 experiments each show that anisomycin or cycloheximide treatment during the experiment abolished spine growth. E) E-LTP, induced by GLU stimulation, was shorter lasting than L-LTP, and was insensitive to anisomycin (8 experiments each). Anisomycin was applied only during the experiments indicated with the open circles. F) Pooled data from 5 spines show an increase in spine volume with GLU+SKF stimulation. Blue and green bars represent forskolin (SKF38393 in F) and anisomycin, respectively. Blue and red arrows represent uncaging tetani. *: p < 0.01 between adjacent bars. †: p < 0.001 in comparison with corresponding baseline. GLU: tetanus of glutamate uncaging (30 pulses of 4ms each at 0.5Hz) at single spine; this is used in figures 1–5, FSK: forskolin (bath applied), VEH: vehicle, ANI: anisomycin, CHX: cycloheximide, SKF: SKF38393. Scale bar represents 10μm. Electrophysiological trace scale bar represents 10ms and 15pA. Normalization performed as percent of average baseline value for each spine. All data mean +/− SEM.
Figure 2
Figure 2. STC occurred at single spines
A) Schematic of STC experiment using GLU+FSK stimulation at 2 spines, the second in the presence of anisomycin (L1, L2). B) Example of L1, L2 spines before L1 stimulation (t=0'), L2 stimulation (t=35'), and at end of experiment (t=100') demonstrating STC. C) Pooled data from 8 experiments show STC at L2. D) STC was abolished by anisomycin applied during L1 and L2 stimulations (5 experiments). E) Schematic of STC using GLU stimulation at spine 2 (E2) after GLU+FSK stimulation at spine 1 (L1). F) Pooled data from 6 experiments show STC at E2. G) STC at E2 was sensitive to anisomycin present during L1 stimulation but not E2 stimulation (5 experiments). H) Pooled data from 5 experiments show that STC occurred at E2 when L1 was given GLU+SKF stimulation. I) Anisomycin present during GLU+SKF stimulation of L1 blocked L-LTP at both L1 and E2 (5 experiments). J) Schematic of STC using GLU stimulation (E1) before GLU+FSK stimulation (L2). K) Pooled data from 7 experiments show STC at E1. L) STC at E1 was sensitive to anisomycin present during L2 stimulation (5 experiments). Blue and red arrows represent uncaging tetanus. Blue and green bars represent forskolin (SKF38393 in H, I) and anisomycin, respectively. *: p < 0.01 between adjacent bars. †: p < 0.001 in comparison with corresponding baseline. GLU: tetanus of glutamate uncaging, FSK: forskolin (bath applied), VEH: vehicle, ANI: anisomycin, CHX: cycloheximide, SKF: SKF38393. Scale bar represents 10μm. Normalization performed as percent of average baseline value for each spine. All data mean +/− SEM.
Figure 3
Figure 3. The temporal bidirectionality of STC was not symmetric
AB) Varying the time between L1 (GLU+FSK stimulation) and L2 (GLU+FSK stimulation with anisomycin) stimulations (A) or L1 (GLU+FSK stimulation) and E2 (GLU stimulation) stimulations (B) demonstrates that the lifetime of the rate-limiting PrP, measured by STC efficiency at L2 (A) or E2 (B), was less than 90min. (A, B: both p < 0.001; n = 3 for each time point) C) Varying the time between E1 (GLU stimulation) and L2 (GLU+FSK stimulation) stimulations showed that the lifetime of the synaptic tag, measured by STC efficiency at E1, was larger than 90min and less than 180min. (p < 0.001; n = 3 for each experiment) D) Strong correlation between the volume of E1 prior to L2 stimulation and E1 at end of experiment demonstrates that L-LTP induction or expression stabilized prior induced E-LTP expression without changing its magnitude. E) Subthreshold stimulation had no effect on spine volume (6 experiments). F) GLU+FSK stimulation at one spine (L1) resulted in STC at second spine (S2) given subthreshold stimulation later (6 experiments). G) GLU+FSK stimulation at one spine (L2) did not result in STC at second spine (S1) given subthreshold stimulation earlier (6 experiments). Black and blue arrows represent subthreshold (1ms) and normal (4ms) uncaging tetani, respectively. Blue bar represents forskolin. *: p < 0.01 between adjacent bars. †: p < 0.001 in comparison with corresponding baseline. GLU: tetanus of glutamate uncaging, FSK: forskolin (bath applied). Normalization performed as percent of average baseline value for each spine. All data mean +/− SEM.
Figure 4
Figure 4. The spatial localization of STC demonstrated the Clustered Plasticity Hypothesis (CPH)
A) Left panel shows example of two spines stimulated on the same branch 50μm apart (measured along the dendrite), whereas the right panel shows an example of two stimulated spines 48μm apart (measured along the dendrite) on adjacent branches. In both cases, the spines (L1, L2) were given GLU+FSK stimulation. L2 was stimulated at 45min in the presence of anisomycin. B) Quantification of several experiments demonstrates that the efficiency of STC decreased with increasing distance, and with stimulated spines being on different branches. C) Replacing L2 with GLU stimulation confirmed that STC efficiency decreased with increasing distance between stimulated spines. Scale bar represents 10μm. Normalization performed as percent of average baseline value for each spine. All data mean +/− SEM.
Figure 5
Figure 5. Competition between spines
A) Pooled data from 7 experiments show that stimulating two spines (10μm–20μm apart; L1, L2; GLU+FSK stimulation) 1min apart resulted in slower growth of both spines compared to stimulating one spine (GLU+FSK stimulation). B) Spine growth was compared between two cases when either a single spine was stimulated (Fig. 1B and Fig. S1A) or two spines 10μm–20μm apart were stimulated successively. C) Representative experiment, showing complementary growth and shrinkage during the first 30min but not after 35min post-stimulation. D) Correlation of the change in spine volume at L1 with the change in spine volume at L2 at each 5min interval shows that L1 and L2 grew independently prior to stimulation, and after 35min post-stimulation. However, within the first 30min after stimulation, one spine grew at the expense of the other. Each time point on the graph represents the difference in volume between two successive time points using spines from 6 independent experiments. E) In contrast to D, there was no correlation between stimulated spines and their neighbors during the 0–30min period indicating that the competition was specific to stimulated spines. F) Pooled data from 6 experiments show that a third spine stimulated with GLU stimulation (E3) could compete for growth with spines given GLU+FSK stimulation earlier (L1, L2). G) Stimulation of E3 slowed growth of L1, L2, quantified by comparing the average growth of L1 and L2 30min after E3 is stimulated with the average growth of L1 and L2 in the absence of E3 stimulation (from Fig. 3D). H) Stimulating two spines with GLU+FSK stimulation prior to later GLU stimulation (E3 after L1, L2) reduced the efficiency of the later stimulation, as compared to stimulating only one spine prior to the later stimulation (E2 after only L1 from Fig. 2L). Blue, teal and red arrows represent uncaging tetani. Blue bar represents forskolin. *: p < 0.01 between adjacent bar. †: p < 0.05 in Figure 5B in comparison between 1 and 2 spines for the 30' time point. GLU: tetanus of glutamate uncaging, FSK: forskolin (bath applied). Normalization performed as percent of average baseline value for each spine. All data mean +/− SEM.
Figure 6
Figure 6. L-LTP induced by stimulation of multiple spines
A) Example of branch with 14 stimulated spines (marked with *). Insets contain examples of a spine that was potentiated (right) and one that was not (left). B, C) Pooled data from 81 spines demonstrates the differences between the potentiated spines (13 spines) and unpotentiated spines (68 spines). Potentiated spines were defined as those that were part of the larger mode in the bimodal distribution of spine volumes shown in Fig. S5D and described in the text. D) Pooled data from 81 spines shows the number of spines that were potentiated as a function of time. Each data set is a single experiment, whose legend indicates the number of spines stimulated during that experiment. Thus when less than 10 spines were stimulated, no spines were potentiated. E) Example with 14 stimulated spines (marked with *) across two sister branches. F) Pooled data from 56 spines shows that no spines were potentiated when the stimulated spines were split across a branch. Each data set is a single experiment, whose legend indicates the number of spines stimulated during that experiment. Blue bar indicates time of SKF38393 addition (for 5min), blue arrow indicates time of uncaging tetanus (100 pulses for 0.1ms each at 2Hz (denoted GLU in Fig. 6 and 7); Tetanus applied such that for each “pulse” of the tetanus, all spines were stimulated in < 6ms). †: p < 0.05 between stimulated condition and baseline condition, *: p < 0.05 between potentiated and unpotentiated state (B) or between <=10 spines and > 10 spines (D). Scale bar represents 5μm. Normalization performed as percent of average baseline value for each spine. All data mean +/− SEM.
Figure 7
Figure 7. L-LTP, E-LTP and STC induced by stimulation of multiple spines
A) Pooled data from 5 experiments, each with 14 spines stimulated on a single branch shows that bath application of the D1R agonist SKF38393 along with pseudosynchronous stimulation of 14 spines resulted in a robust difference in spine volume between potentiated and unpotentiated spines. The increased spine volume lasted throughout the experiment. B) Pooled data from 5 experiments, each with 14 spines stimulated on a single branch, shows that pseudosynchronous stimulation of 14 spines resulted in a robust difference in spine volume between potentiated and unpotentiated spines. However, the potentiated spines' volume returned to baseline within 3 hrs. C) Quantification of the data from A, B shows that the increased spine volume was statistically significant. D) Pooled data from 5 experiments shows that the number of spines that underwent L-LTP was less than the number of spines that underwent E-LTP in our conditions. E) When SKF38393 was bath applied along with pseudosynchronous stimulation of 14 spines (L1), followed 40min later by pseudosynchronous stimulation of another set of 14 spines (E2), 4 populations of potentiated spines were seen (unpotentiated spines are not shown in the graph for clarity). Some L1 spines (blue solid circles) were potentiated throughout the experiments, whereas some L1 spines (blue open circles) that were potentiated just prior to E2 stimulation returned to baseline shortly afterwards. Amongst spines that were potentiated as a result of E2 stimulation, there were also two groups. Most of the spines (red open spines) returned to baseline but some (red solid circles) stayed potentiated throughout the rest of the experiment. F) Pooled data from 5 experiments showing the number of spines that belong to the four groups in D. Note that there was a statistical difference between the number of L1 spines potentiated at 30' vs. 270', and that the number of E2 spines potentiated at 270' is significantly different than 0. Also, there was no statistical difference between the total number of spines potentiated at 30' and at 270'. G) Plot of probability of spines transitioning from unpotentiated state to potentiated state (top half) and vice versa (bottom half). In the case of E-LTP, there was an initial burst of potentiation at 5min, followed by an unpotentiation period from 120min – 180min. In the case of L-LTP, both potentiation and unpotentiation occurred at significant amounts throughout the first 60min after stimulation. Since the number of potentiated spines was constant (D), this supports the case for competition amongst spines. Blue bar indicates time of SKF38393 addition (for 5min), blue, red arrow indicates time of uncaging tetanus. †: p < 0.05 between later time points and baseline conditions, *: p < 0.05 between potentiated and unpotentiated state (Fig 7C), between 60min and 240min (Fig 7D) or between 30min and 270min (Fig 7F). SKF: SKF38393. GLU: Tetanus of glutamate uncaging. Normalization performed as percent of average baseline value for each spine. All data mean +/− SEM.

Similar articles

Cited by

References

    1. Abel T, Nguyen PV, Barad M, Deuel TA, Kandel ER, Bourtchouladze R. Genetic demonstration of a role for PKA in the late phase of LTP and in hippocampus-based long-term memory. Cell. 1997;88:615–626. - PubMed
    1. Asrican B, Lisman J, Otmakhov N. Synaptic strength of individual spines correlates with bound Ca2+-calmodulin-dependent kinase II. J Neurosci. 2007;27:14007–14011. - PMC - PubMed
    1. Ballarini F, Moncada D, Martinez MC, Alen N, Viola H. Behavioral tagging is a general mechanism of long-term memory formation. Proc Natl Acad Sci U S A. 2009;106:14599–14604. - PMC - PubMed
    1. Barrett AB, Billings GO, Morris RG, van Rossum MC. State based model of long-term potentiation and synaptic tagging and capture. PLoS Comput Biol. 2009;5:e1000259. - PMC - PubMed
    1. Chutkow JG. Metabolism of magnesium in central nervous system. Relationship between concentrations of magnesium in cerebrospinal fluid and brain in magnesium deficiency. Neurology. 1974;24:780–787. - PubMed

Publication types

LinkOut - more resources