. 2011 Jan 25;108(4):1705-10.
doi: 10.1073/pnas.1010122108. Epub 2011 Jan 10.

Deep bradycardia and heart block caused by inducible cardiac-specific knockout of the pacemaker channel gene Hcn4

Affiliations

Deep bradycardia and heart block caused by inducible cardiac-specific knockout of the pacemaker channel gene Hcn4

Mirko Baruscotti et al. Proc Natl Acad Sci U S A. .

Abstract

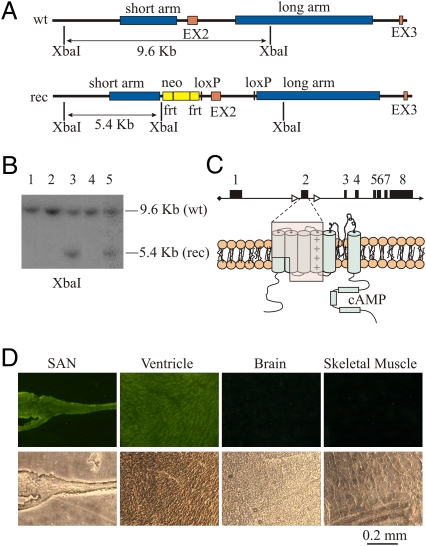
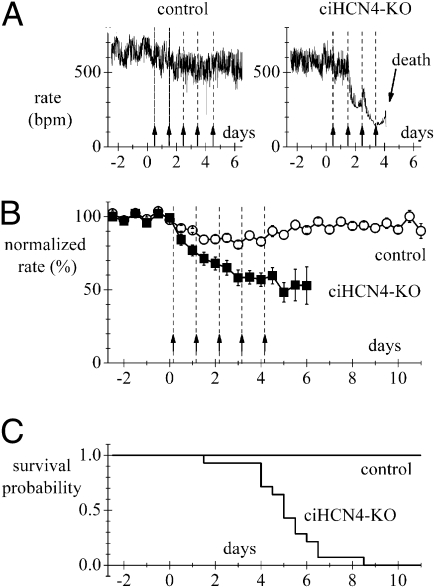
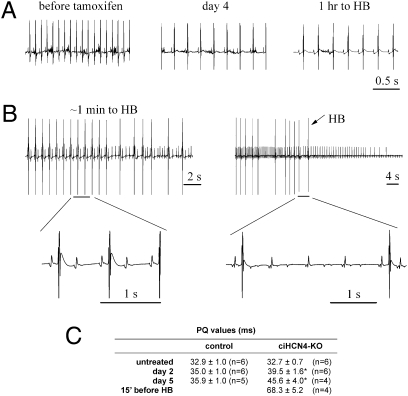
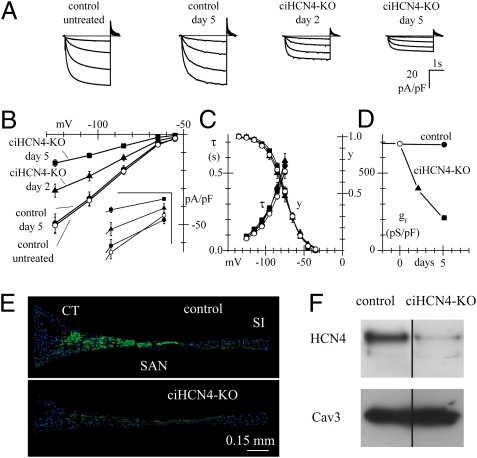
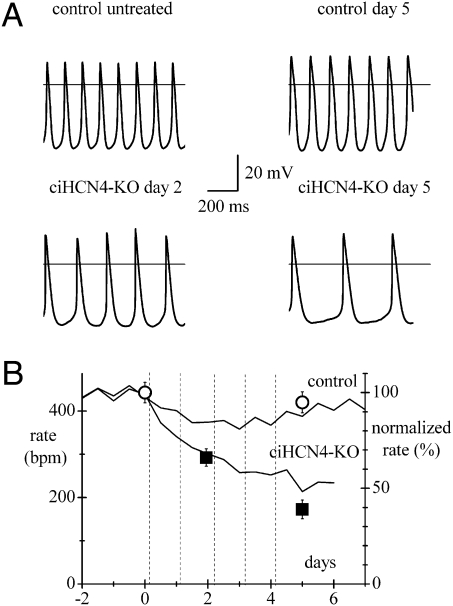
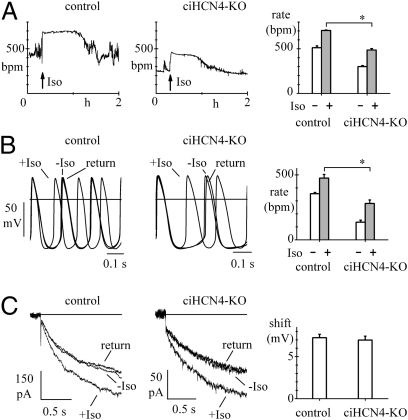
Cardiac pacemaking generation and modulation rely on the coordinated activity of several processes. Although a wealth of evidence indicates a relevant role of the I(f) ("funny," or pacemaker) current, whose molecular constituents are the hyperpolarization-activated, cyclic nucleotide-gated (HCN) channels and particularly HCN4, work with mice where Hcn genes were knocked out, or functionally modified, has challenged this view. However, no previous studies used a cardiac-specific promoter to induce HCN4 ablation in adult mice. We report here that, in an inducible and cardiac-specific HCN4 knockout (ciHCN4-KO) mouse model, ablation of HCN4 consistently leads to progressive development of severe bradycardia (∼50% reduction of original rate) and AV block, eventually leading to heart arrest and death in about 5 d. In vitro analysis of sinoatrial node (SAN) myocytes isolated from ciHCN4-KO mice at the mean time of death revealed a strong reduction of both the I(f) current (by ∼70%) and of the spontaneous rate (by ∼60%). In agreement with functional results, immunofluorescence and Western blot analysis showed reduced expression of HCN4 protein in SAN tissue and cells. In ciHCN4-KO animals, the residual I(f) was normally sensitive to β-adrenergic receptor (β-AR) modulation, and the permanence of rate response to β-AR stimulation was observed both in vivo and in vitro. Our data show that cardiac HCN4 channels are essential for normal heart impulse generation and conduction in adult mice and support the notion that dysfunctional HCN4 channels can be a direct cause of rhythm disorders. This work contributes to identifying the molecular mechanism responsible for cardiac pacemaking.


Conflict of interest statement

The authors declare no conflict of interest.

Figures

Fig. 1.
Fig. 1.
Generation of Hcn4lox/lox,Cre transgenic mice and cardiac specificity of the knockout process. (A) Structure of the wild type (wt) and recombinant (rec) Hcn4 alleles. The long and short arms of homology used for the recombination process and the loxP sites and the neomycin resistance cassette (neo) used for cell selection are shown. (B) Southern blot analysis of XbaI restriction fragments of DNA extracted from five clones; the two bands in lanes 3 and 5 confirm the presence of one recombinant allele. (C) The Cre-induced removal of exon 2 (Upper) eliminates a large part of the protein (Lower, shaded area) and generates a frameshift leading to an early stop codon three residues downstream of R262; this results in a DNA sequence coding for a truncated protein including only the HCN4 N terminus. (D) Tissue slices obtained from sinoatrial node (SAN), ventricle, brain, and skeletal muscle extracted from an MCM, ROSA26-EYFP transgenic mouse at day 5 of Tam treatment. The expression of enhanced yellow fluorescent protein (EYFP) is restricted to the SAN and the ventricle as expected for a cardiac conditional activation of Cre-recombinase. Each fluorescent image (Upper panels) is paired with the corresponding bright-field image (Lower panels). Further details are in SI Materials and Methods.
Fig. 2.
Fig. 2.
Knockout of HCN4 induces deep bradycardia and is lethal. (A) Representative traces of telemetric heart rate recorded from freely moving control (Left) and ciHCN4-KO mice (Right). Administration of Tam is indicated by arrows; 8:00 AM of the day of the first injection was conventionally set as time 0. (B) Mean time courses of normalized heart rates for control (n = 14) and ciHCN4-KO (n = 14) mice during Tam treatment. For each day, two data points were calculated by averaging rates in the intervals 8:00–10:00 AM and 8:00–10:00 PM. These values where then normalized to a baseline heart rate, corresponding to the average heart rate in the same time periods collected for 2–5 d before initiation of the Tam treatment. (C) Kaplan–Meier survival curves for the same sets of control and ciHCN4-KO mice as in B, illustrating the rapid decay of survival probability for ciHCN4-KO mice.
Fig. 3.
Fig. 3.
Development of heart block (HB) in ciHCN4-KO mice. (A) Typical telemetric ECG recordings from a ciHCN4-KO mouse before the first Tam injection (452.4 ± 0.7 bpm), at day 4 (240.8 ± 1.3 bpm), and 1 h before HB and death of the animal (day 4.77, 210.2 ± 0.5 bpm). (B) Traces recorded 1 min (Left) and just before HB (Right), indicating the progression of second-degree AV block from 2:1–4:1 and higher conduction ratios. Heart arrest occurred shortly after the last QRS complex of the ECG recorded (Right). Selected portions of traces are shown on an expanded time scale. (C) Mean PQ values measured during the Tam procedure in control and ciHCN4-KO mice. For each mouse, a mean PQ was measured from 3-min-long recordings, and values in the table were averaged over the number of mice indicated (*P < 0.05 vs. day-matched control).
Fig. 4.
Fig. 4.
Reduction of HCN4 expression in pacemaker cells and tissue from ciHCN4-KO mice. (A) Representative If traces (normalized to cell capacitance) during steps to −65/−125 mV (20-mV intervals, holding potential −35 mV) from SAN cells isolated from a control and a ciHCN4-KO mouse at various times during the Tam procedure. (B) Mean steady-state current/voltage (I/V) curves recorded in control mice before (open circles, n = 44/9 cells/mice) and at day 5 (solid circles, n = 42/8) and in ciHCN4-KO mice at day 2 (solid triangles, n = 32/5) and day 5 of Tam treatment (solid squares, n = 42/7). (Inset) Data at −55 and −65 mV on an expanded scale (vertical bar 5 pA/pF; horizontal bar 10 mV). At all voltages, means of If current density of control untreated and control day 5 mice were not significantly different (t test, P > 0.05), and data were pooled together for further statistical analysis. Means of If current density from control, ciHCN4-KO day 2, and ciHCN4-KO day 5 mice were compared by one-way ANOVA followed by Fisher test (0.05 significance level), which showed that, for each voltage, the ciHCN4-KO day 2 mean is significantly different from the ciHCN4-KO day 5 mean and that both are significantly different from the control mean. (C) Mean If activation (y) and activation time constant (τ) curves measured in cells from the same groups as in B. Data points of activation curves were fitted with the Boltzmann equation. Half-activation voltages and inverse-slope factors, respectively, were the following: −75.0 mV, 11.2 mV (control untreated, n = 30); −75.1 mV, 11.1 mV (control day 5, n = 19); −74.2 mV, 10.1 mV (ciHCN4-KO day 2, n = 15); and −76.0 mV, 11.7 mV (ciHCN4-KO day 5, n = 11). Time constant curves were the mean from n = 15, n = 17; n = 12 and n = 7 for the same categories above, respectively. (D) Mean normalized If conductance (gf) measured from the data in B as the I/V slope in the interval −105/−125 mV. (E) HCN4 immunolabeling (green) of intercaval tissue slices obtained from representative control and Tam-treated ciHCN4-KO mice. Nuclei are labeled with DAPI (blue). CT, crista terminalis; SI, septum interatrialis. (F) Western blot of total SAN protein extracts (30 μg/lane) showing expression of the HCN4 protein in control and 4.5-d Tam-treated ciHCN4-KO mice. Cav3: loading control.
Fig. 5.
Fig. 5.
Effects of HCN4 knockout on spontaneous activity of single SAN cells. (A) Sample action potentials recorded from SAN cells isolated from control mice before and at day 5 (Upper panels) and from ciHCN4-KO mice at day 2 and day 5 of Tam treatment. Rates from 2- to 4-s-long recordings were 434.4, 436.4, 288.1, and 170.4 bpm, respectively. (B) Mean rates from cells of the same mouse categories as in A plotted against the time of recording. Control rates were 444.5 ± 23.7 bpm (untreated, n = 15/8 cells/mice) and 422.0 ± 24.5 bpm (5-d exposure to Tam or vehicle, n = 12/6 cells/mice); ciHCN4-KO rates were 293.6 ± 20.2 bpm (day 2, n = 20/6 cells/mice) and 173.1 ± 21.6 bpm (day 5, n = 26/9 cells/mice). All values were significantly different from each other (P < 0.05) except control vs. control day 5. The y axis on the right represents normalized values. The time courses of mean normalized telemetric heart rate of control and ciHCN4-KO mice from Fig. 2B are also plotted for comparison.
Fig. 6.
Fig. 6.
Response to β-AR stimulation. (A) Representative telemetry recordings from a control mouse (Left) and a ciHCN4-KO mouse (Center) at the fifth day of Tam treatment showing rate responses to the injection of Iso (arrows; Materials and Methods). (Right) Mean rates before and after Iso from control treated (n = 5) and ciHCN4-KO mice (n = 7). (B) Representative traces showing acceleration of spontaneous activity of two SAN cells from a control treated (Left) and a ciHCN4-KO mouse (center) exposed to 1 μM Iso. (Right) Mean spontaneous rates before and after Iso in cells from control treated (n = 6) and ciHCN4-KO mice (n = 10). (C) Action of 1 μM Iso on If recorded at −75 mV in SAN cells isolated from typical control (Left) and ciHCN4-KO mice (Center). (Right) Mean shifts of the If activation curve caused by 1 μM Iso in cells from control treated mice (n = 12) and ciHCN4-KO mice (n = 7). Asterisks in A and B indicate significant differences (P < 0.05). Records in B and C are before, during, and after Iso as indicated.

References

    1. Lakatta EG, DiFrancesco D. What keeps us ticking: A funny current, a calcium clock, or both? J Mol Cell Cardiol. 2009;47:157–170. - PMC - PubMed
    1. Mangoni ME, Nargeot J. Genesis and regulation of the heart automaticity. Physiol Rev. 2008;88:919–982. - PubMed
    1. Altomare C, et al. Heteromeric HCN1-HCN4 channels: A comparison with native pacemaker channels from the rabbit sinoatrial node. J Physiol. 2003;549:347–359. - PMC - PubMed
    1. Brioschi C, et al. Distribution of the pacemaker HCN4 channel mRNA and protein in the rabbit sinoatrial node. J Mol Cell Cardiol. 2009;47:221–227. - PubMed
    1. Tellez JO, et al. Differential expression of ion channel transcripts in atrial muscle and sinoatrial node in rabbit. Circ Res. 2006;99:1384–1393. - PubMed

Publication types

MeSH terms

Substances