

doi: 10.1073/pnas.1006652108.
Epub 2011 Jan 10.
Density functional theory in surface chemistry and catalysis
Affiliations
- PMID: 21220337
- PMCID: PMC3024687
- DOI: 10.1073/pnas.1006652108
Item in Clipboard
Density functional theory in surface chemistry and catalysis
Proc Natl Acad Sci U S A.
.
Abstract
Recent advances in the understanding of reactivity trends for chemistry at transition-metal surfaces have enabled in silico design of heterogeneous catalysts in a few cases. The current status of the field is discussed with an emphasis on the role of coupling theory and experiment and future challenges.
Conflict of interest statement
The authors declare no conflict of interest.
Figures
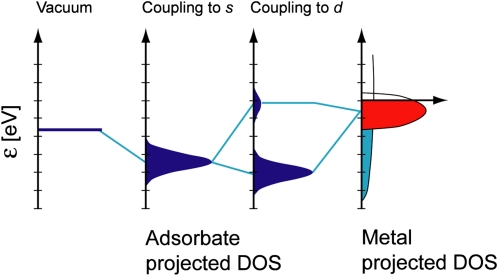
Bond formation at a transition-metal surface. Schematic illustration of the formation of a chemical bond between an adsorbate valence level and the s and d states of a transition-metal surface. The bond is characterized by the degree to which the antibonding state between the adsorbate state and the metal d states is occupied. The higher the d states are in energy relative to the Fermi level, the more empty the antibonding states and the stronger the adsorption bond. Adapted from ref. . DOS, density of states.
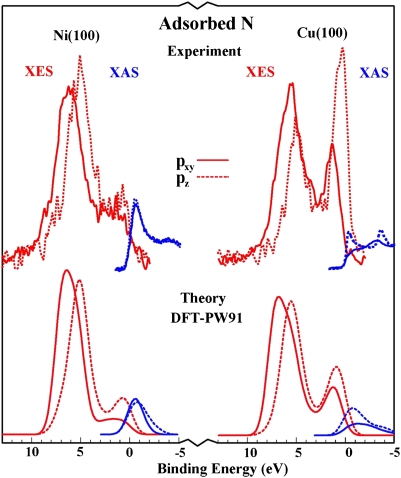
Experimental verification of the d-band model. (Upper) Experimental X-ray emission (XES) and X-ray adsorption (XAS) spectra for N adsorbed onto Ni and Cu surfaces. The bonding and antibonding states originating from the adsorbate pxy and pz states and the metal d states are clearly seen. For Cu with the lowest-lying d states, the antibonding states are filled and the adsorption bond is weak. Adapted from ref. .
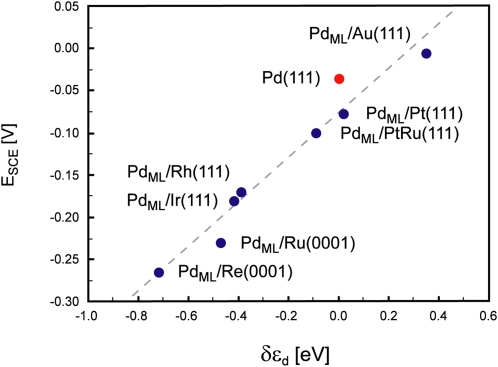
Illustration of the use of the d-band model. Electrochemically measured changes in the hydrogen adsorption energy (ESCE) for Pd overlayers on a number of metals are shown to scale well with the calculated shift of the d-band center (δεd). Adapted from ref. .
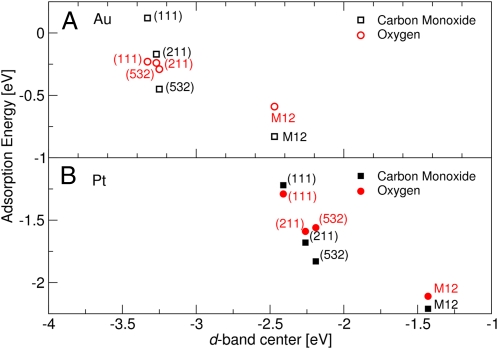
Illustration of the extent of the d-band model. Calculated CO and O adsorption energies for a range of different Au (A) and Pt (B) surfaces including 12 atom clusters are seen to correlate with the calculated d-band center (εd). Adapted from ref. .
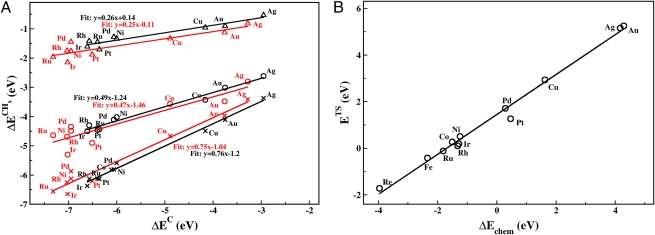
Illustration of scaling relations. The plot on the left shows how all calculated CHx adsorption energies scale with the adsorption energy of C for a number of metal surfaces (close-packed, black; stepped, red). The slope is given entirely by bond counting. Adapted from ref. . The plot on the right shows how the activation energy for CO dissociation over stepped surfaces scales with the dissociative chemisorption energy of the reaction.
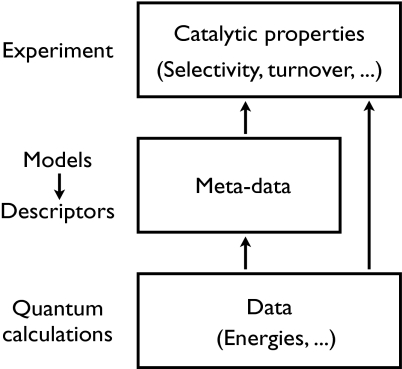
Illustration of the link between the microscopic surface properties and the macroscopic catalytic properties as measured in a catalytic converter. They are directly linked through the kinetics, but it is far more instructive to develop models that map the large number of microscopic properties characterizing the catalyst onto a few descriptors.
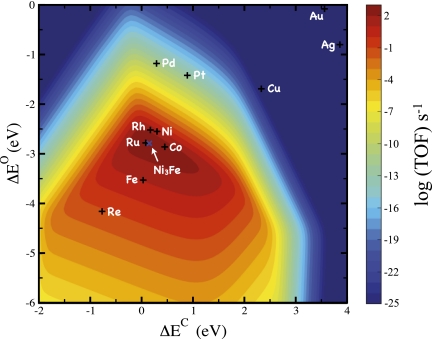
Theoretical volcano for the production of methane from syngas, CO, and H2. The turnover frequency (TOF) is plotted as a function of carbon and oxygen binding energies. The carbon and oxygen binding energies for the stepped 211 surfaces of selected transition metals are depicted. Reaction conditions are 573 K, 40 bar H2, 40 bar CO.
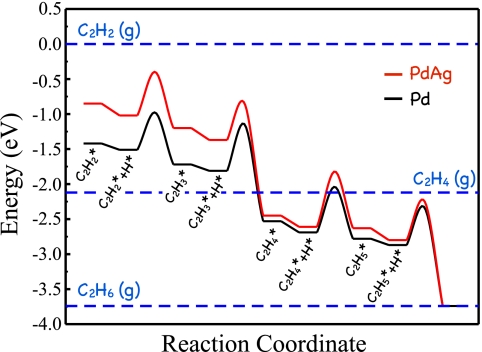
Potential energy diagram obtained from DFT calculations for the hydrogenation of acetylene to ethane on close-packed surfaces of Pd (black) and PdAg (red) surfaces. Adapted from ref. .
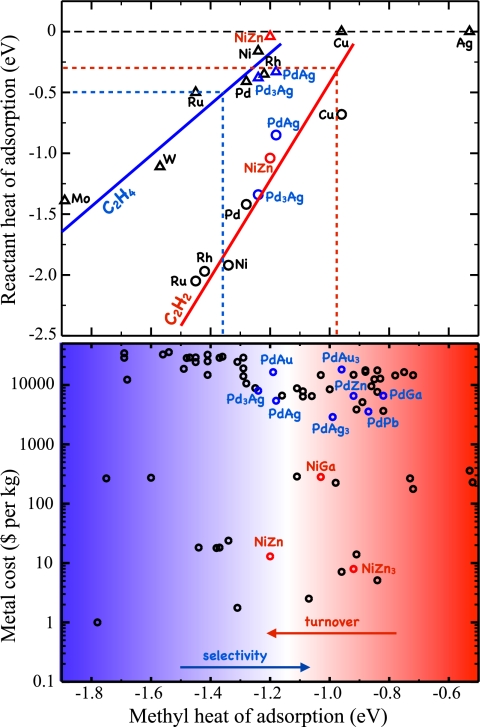
(Upper) Adsorption energy for acetylene and ethylene plotted against the adsorption energy of a methyl group. The solid lines show the predicted acetylene (red) and ethylene (blue) adsorption energies from scaling. The dotted lines define the region of interest, where the ethylene adsorption energy is less than the barrier for further hydrogenation (blue) and where the reactivity of the acetylene hydrogenation step is estimated to be 1 s−1 per site (red). (Lower) Cost (in 2006 metal prices) of 70 binary intermetallic compounds plotted against the calculated methyl adsorption energies. The smooth transition between regions of low and high selectivity (blue) and high and low reactivity (red) is indicated. Adapted from ref. .
References
-
- Maxwell IE. Driving forces for studies in catalysis. Stud Surf Sci Catal. 1996;101:1–9.
-
- Office of Basic Energy Sciences, US Department of Energy. Basic Energy Needs for Solar Energy Utilization, Workshop Report. 2005. Available at http://www.er.doe.gov/bes/reports. Accessed June 1, 2010.
-
- Office of Basic Energy Sciences, US Department of Energy. Basic Energy Needs Catalysis for Energy, Workshop Report. 2007. Available at http://www.er.doe.gov/bes/reports. Accessed June 1, 2010.
-
- Valden M, Lai X, Goodman DW. Onset of catalytic activity of gold clusters on titania with the appearance of nonmetallic properties. Science. 1998;281:1647–1650. - PubMed
Publication types
MeSH terms
Substances
LinkOut - more resources
Full Text Sources
Other Literature Sources
