. 2011 Jun;28(6):1817-26.
doi: 10.1093/molbev/msr004. Epub 2011 Jan 10.

Ecologically and evolutionarily important SNPs identified in natural populations

Affiliations

Ecologically and evolutionarily important SNPs identified in natural populations

Larissa M Williams et al. Mol Biol Evol. 2011 Jun.

Abstract

Evolution by natural selection acts on natural populations amidst migration, gene-by-environmental interactions, constraints, and tradeoffs, which affect the rate and frequency of adaptive change. We asked how many and how rapidly loci change in populations subject to severe, recent environmental changes. To address these questions, we used genomic approaches to identify randomly selected single nucleotide polymorphisms (SNPs) with evolutionarily significant patterns in three natural populations of Fundulus heteroclitus that inhabit and have adapted to highly polluted Superfund sites. Three statistical tests identified 1.4-2.5% of SNPs that were significantly different from the neutral model in each polluted population. These nonneutral patterns in populations adapted to highly polluted environments suggest that these loci or closely linked loci are evolving by natural selection. One SNP identified in all polluted populations using all tests is in the gene for the xenobiotic metabolizing enzyme, cytochrome P4501A (CYP1A), which has been identified previously as being refractory to induction in the three highly polluted populations. Extrapolating across the genome, these data suggest that rapid evolutionary change in natural populations can involve hundreds of loci, a few of which will be shared in independent events.


Figures

F<sc>IG</sc>. 1.
FIG. 1.
Fundulus heteroclitus sampling sites along the East coast of the United States. Polluted sites are starred and flanked north and south by clean reference sites (circles) to form a triad. Each polluted site with its two clean reference sites is referred to as a triad of which there are three. Variation among the two reference sites captures the random/neutral variation. Thus, differences in a polluted population versus both reference populations most likely are due to evolved responses to pollution. Venn diagrams indicate the number of SNPs exhibiting nonneutral behavior using the three statistical tests: the FST modeling approach (FST), Association (Assoc.), and MAF-Fmax (MAF).
F<sc>IG</sc>. 2.
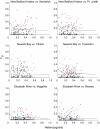
FIG. 2.
FST modeling approach to detect selection. Empirical FST values are plotted against heterozygosity. The line demarks the 99th percentile estimated from a simulation model. Blue diamonds indicate SNPs that are significantly different between the polluted population and both reference populations but not different for reference versus reference. Red dots are superimposed on blue diamonds if the SNP was also significant in the other two statistical tests. Less interesting are the crosses and open diamonds. Black crosses are outliers also in the reference versus reference comparison. Open diamonds represent outliers where the polluted population was only significant in comparison with one reference population.
F<sc>IG</sc>. 3.
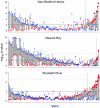
FIG. 3.
Association test for detection of selection. Likelihood of association of each SNP with either the polluted site (red points) or reference sites (blue points) as a −log10 P value. The −log10 P value of 2 is marked by a black line, and the Bonferroni correction for multiple testing is marked by the dotted gray line (−log10 P value of 4.55). SNPs are ordered by increasing likelihood ratio test statistics. SNPs are identified as outliers in polluted sites versus reference sites if the polluted association value is greater than 2 and the likelihood ratio test P value of polluted versus reference association is ≤0.01 (points to the right of the vertical line on the x axis, supplementary table S1, Supplementary Material online). Large red dots denote SNPs also significant in the other two statistical tests.
F<sc>IG</sc>. 4.
FIG. 4.
MAF-Fmax test for detection of differences in SNP allele frequencies between polluted and reference sites. (A) The allele frequency of the triad-wide minor allele was calculated and plotted for all SNPs. Columns are collection sites arranged north to south, and each row represents an individual SNP. Sites left to right are as follows: (a) Sandwich, MA, USA; (b) New Bedford Harbor, MA, USA; (c) Point Judith, RI, USA; (d) Clinton, CT, USA; (e) Newark, NJ, USA; (f) Tuckerton, NJ, USA; (g) Magotha, VA, USA; (h) Elizabeth River, VA, USA; and (i) Manteo, NC, USA. (B) SNPs with allele frequencies significantly different in an ANOVA using Fmax (Westfall and Young 1993) to control for type I errors among iterations (Fmax: empirical F value exceeds the top 1% of all permutated F values assuming random population differentiation) between polluted (P) and both reference sites (R1 and R2) are plotted. In the New Bedford Harbor triad, sites left to right are (a) Sandwich, MA USA; (b) New Bedford Harbor, MA USA; and (c) Point Judith, RI, USA. In the Newark Bay triad, sites left to right are: (a) Clinton, CT, USA; (b) Newark, NJ, USA; and (c) Tuckerton, NJ, USA. In the Elizabeth River triad, sites left to right are: (a) Magotha, VA, USA; (b) Elizabeth River, VA USA; and (c) Manteo, NC, USA. Red dots denote SNPs exhibiting nonneutral behavior in all three statistical tests. The SNP exhibiting nonneutral behavior in all three triads and using all tests (CYP1A +268) is boxed.

References

    1. Adams SM, Lindmeier JB, Duvernell DD. Microsatellite analysis of the phylogeography, Pleistocene history and secondary contact hypotheses for the killifish, Fundulus heteroclitus. Mol Ecol. 2006;15:1109–1123. - PubMed
    1. Aljanabi SM, Martinez I. Universal and rapid salt-extraction of high quality genomic DNA for PCR-based techniques. Nucleic Acids Res. 1997;25:4692–4693. - PMC - PubMed
    1. Ayroles JF, Carbone MA, Stone EA, et al. (11 co-authors) Systems genetics of complex traits in Drosophila melanogaster. Nat Genet. 2009;41:299–307. - PMC - PubMed
    1. Beaumont M, Nichols R. Evaluating loci for use in the genetic analysis of population structure. Proc R Soc Lond Biol Sci. 1996;263:1619–1626.
    1. Begun DJ, Holloway AK, Stevens K, et al. (13 co-authors) Population genomics: whole-genome analysis of polymorphism and divergence in Drosophila simulans. PLoS Biol. 2007;5:e310. - PMC - PubMed

Publication types