

doi: 10.1038/nbt.1754.
Integrative genomics viewer
- PMID: 21221095
- PMCID: PMC3346182
- DOI: 10.1038/nbt.1754
Item in Clipboard
Integrative genomics viewer
Nat Biotechnol.
2011 Jan.
No abstract available
Figures
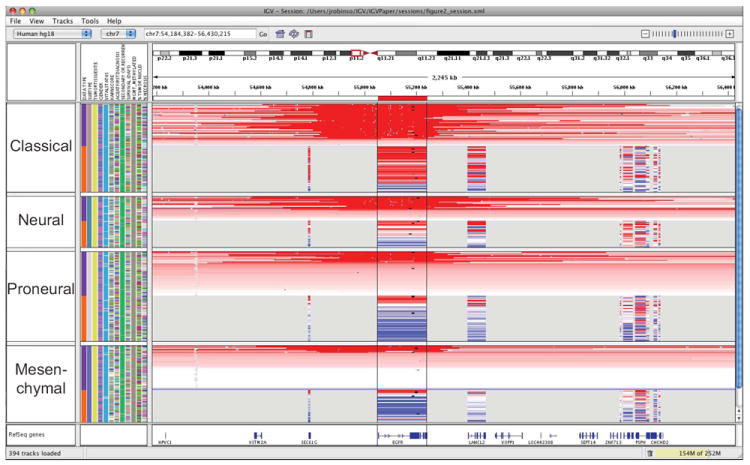
This figure illustrates an integrated, multi-modal view of 202 glioblastoma multiforme TCGA samples. Copy number data is segmented values from Affymetrix SNP 6.0 arrays. Expression data is limited to genes represented on all TCGA employed platforms and displayed across the entire gene locus. Red shading indicates relative up-regulation of a gene and the degree of copy gain of a region; blue shading indicates relative down-regulation and copy loss. Small black squares indicate the position of point missense mutations. Samples are grouped by tumor subtype (2nd annotation column) and data type (1st sample annotation column), and sorted by copy number of the EGFR locus. Linking via sample attributes insures that the order of sample tracks is consistent across data types within their respective tumor subtypes.
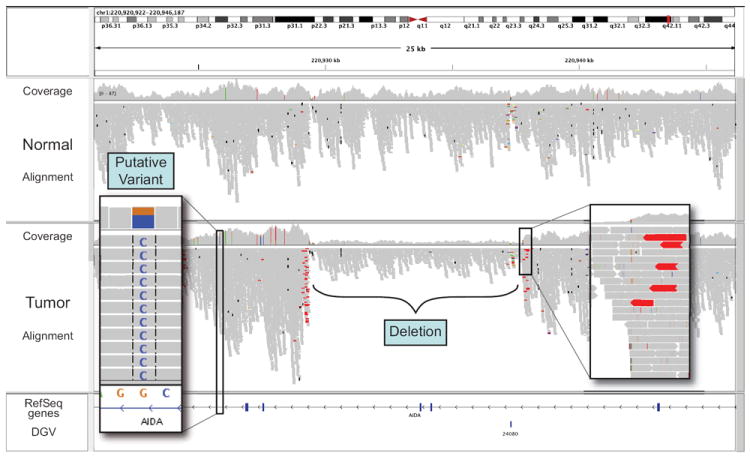
Coverage plot and alignments from paired-end reads for a matched tumor/normal pair. Sequencing was performed on an Illumina GA2 platform and aligned with Maq. Alignments are represented as gray polygons with reads mismatching the reference indicated by color. Loci with a large percentage of mismatches relative to the reference are flagged in the coverage plot as color-coded bars. Alignments with unexpected inferred insert sizes are indicated by color. There is evidence for an approximately 10kb deletion (removing 2 exons of AIDA) in the tumor sample not present in the normal.
References
-
- Cancer Genome Atlas Research Network. Nature. 2008;455:1061–1068.
-
- The ENCODE Project Consortium. Science. 2004;306:636–640. - PubMed
-
- Berger MF, et al. Genome Res. 2010;20 Epub ahead of print.
Publication types
MeSH terms
Grants and funding
LinkOut - more resources
Full Text Sources
Other Literature Sources
