

Effect of population structure corrections on the results of association mapping tests in complex maize diversity panels
- PMID: 21221527
- PMCID: PMC3057001
- DOI: 10.1007/s00122-010-1519-y
Effect of population structure corrections on the results of association mapping tests in complex maize diversity panels
Abstract
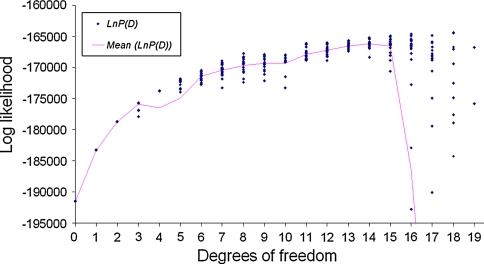
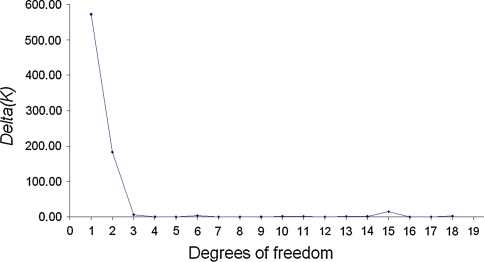
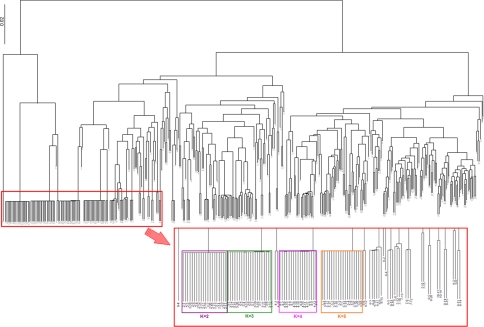
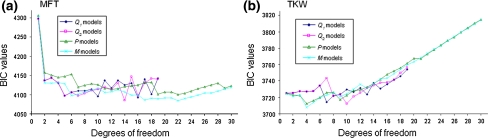
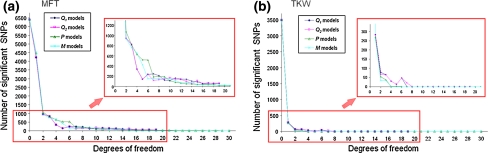
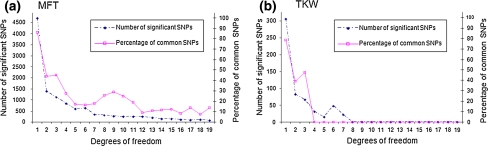
Association mapping of sequence polymorphisms underlying the phenotypic variability of quantitative agronomical traits is now a widely used method in plant genetics. However, due to the common presence of a complex genetic structure within the plant diversity panels, spurious associations are expected to be highly frequent. Several methods have thus been suggested to control for panel structure. They mainly rely on ad hoc criteria for selecting the number of ancestral groups; which is often not evident for the complex panels that are commonly used in maize. It was thus necessary to evaluate the effect of the selected structure models on the association mapping results. A real maize data set (342 maize inbred lines and 12,000 SNPs) was used for this study. The panel structure was estimated using both Bayesian and dimensional reduction methods, considering an increasing number of ancestral groups. Effect on association tests depends in particular on the number of ancestral groups and on the trait analyzed. The results also show that using a high number of ancestral groups leads to an over-corrected model in which all causal loci vanish. Finally the results of all models tested were combined in a meta-analysis approach. In this way, robust associations were highlighted for each analyzed trait.
Figures
References
-
- Abdurakhmonov IY, Saha S, Jenkins JN, Buriev ZT, Shermatov SE, Scheffler BE, Pepper AE, Yu JZ, Kohel RJ, Abdukarimov A. Linkage disequilibrium based association mapping of fiber quality traits in G. hirsutum L. variety germplasm. Genetica. 2009;136:401–417. doi: 10.1007/s10709-008-9337-8. - DOI - PubMed
-
- Benjamini Y, Hochberg Y. Controlling the false discovery rate: a practical and powerful approach to multiple testing. J R Stat Soc. 1995;57:289–300.
-
- Buckler ES, Stevens NM. Maize origins, domestication, and selection. In: Motley TJ, Zerega N, Cross H, editors. Darwin’s harvest. New York: Columbia University Press; 2005. pp. 67–90.
-
- Camus-Kulandaivelu L, Veyrieras JB, Madur D, Combes V, Fourmann M, Barraud S, Dubreuil P, Gouesnard B, Manicacci D, Charcosset A. Maize adaptation to temperate climate: relationship between population structure and polymorphism in the Dwarf8 gene. Genetics. 2006;172:2449–2463. doi: 10.1534/genetics.105.048603. - DOI - PMC - PubMed
Publication types
MeSH terms
LinkOut - more resources
Full Text Sources
