Review
. 2011 Apr;68(8):1369-94.
doi: 10.1007/s00018-010-0614-1. Epub 2011 Jan 8.

Purinergic signaling in embryonic and stem cell development

Affiliations
Review

Purinergic signaling in embryonic and stem cell development

Geoffrey Burnstock et al. Cell Mol Life Sci. 2011 Apr.

Abstract

Nucleotides are of crucial importance as carriers of energy in all organisms. However, the concept that in addition to their intracellular roles, nucleotides act as extracellular ligands specifically on receptors of the plasma membrane took longer to be accepted. Purinergic signaling exerted by purines and pyrimidines, principally ATP and adenosine, occurs throughout embryologic development in a wide variety of organisms, including amphibians, birds, and mammals. Cellular signaling, mediated by ATP, is present in development at very early stages, e.g., gastrulation of Xenopus and germ layer definition of chick embryo cells. Purinergic receptor expression and functions have been studied in the development of many organs, including the heart, eye, skeletal muscle and the nervous system. In vitro studies with stem cells revealed that purinergic receptors are involved in the processes of proliferation, differentiation, and phenotype determination of differentiated cells. Thus, nucleotides are able to induce various intracellular signaling pathways via crosstalk with other bioactive molecules acting on growth factor and neurotransmitter receptors. Since normal development is disturbed by dysfunction of purinergic signaling in animal models, further studies are needed to elucidate the functions of purinoceptor subtypes in developmental processes.


Figures
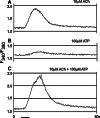
Fig. 1
Fig. 1
Interaction between acetylcholine (ACh) and ATP recorded in an otocyst from chick embryo. a The response to 10 μM acetylcholine. b The response to 100 μM ATP. c The response to the co-application of 10 μM acetylcholine and 100 μM ATP. The records in a–c were taken in this order at 5-min intervals. The bath solutions contained 25 mM Ca2+ (reproduced form [26] with permission from John Wiley and Sons Ltd.)
Fig. 2
Fig. 2
Expression of P2Y1 receptors during embryonic development of the chick as visualized by whole-mount in situ hybridization. Stages of development are shown in bottom right corner. a Ventral view of stage 20 embryo showing P2Y1 expression in mesonephros and limb buds (scale bar 200 μm). b Lateral view of the chick somite at stage 21 showing P2Y1 expression in the anterior region. The dark area in the head region is due to an artefact of photography (scale bar 200 μm). c Dorsal view of stage 36 brain (anterior to the left), showing increased levels of expression in telecephlon (tel), dorsal diencephlon and posterior midbrain. Mes mesencephalon, cb cerebellum (scale bar 1 mm). d An anterior-uppermost view of a leg at embryonic stage 33. Expression of P2Y1 is seen in the digits, but not in areas of joint formation. The same expression pattern is also seen in the wing (scale bar 100 μm) (reproduced from [29] with permission from Wiley-Liss, Inc.)
Fig. 3
Fig. 3
K+ responses to ATP analogues of a mouse mesodermal cell line. Each of the two traces was obtained from the same cell (ae). The responses induced by ATP (left traces) and ATP analogues (right traces) are shown. The names of the analogues are shown near the traces. Each drug was applied at 20 μM, and the holding potentials were 0 mV (reproduced from [34] with permission from John Wiley and Sons)
Fig. 4
Fig. 4
Location of the muscles of the chick embryo that were responsive to ATP. Three chick embryos from stages 35–37 were killed, and each muscle was identified and tested in at least two of the three embryos. All muscles tested in embryos of these ages contracted in response to ATP. By embryo day 17 (stage 43), none of the muscles contracted in response to ATP (reproduced from [79] with permission from Wiley-Liss, Inc.)
Fig. 5
Fig. 5
Immunoreactivity for P2X3 receptors in the trigeminal nucleus (Me5) of E16 (A, B) and P7 (C, D) rats. Immunohistochemistry was performed with a polyclonal antibody raised to a nine-amino-acid peptide identical to the carboxy terminus of the rat P2X3 receptor. The sections were counter-stained using Methyl Green. Labeled cell bodies can be detected for the majority of the Me5 neurons in the E16 rat (a, b) while in the P7 rat (c, d) a diminishing subpopulation of cells was labeled. Fibers and processes can clearly be seen in the P7 animal (arrowhead d). No staining was seen in control sections incubated with pre-immune serum in place of the P2X3 antibody (b). Scale bars 25 μm (a, b, d), 50 μm (c) (reproduced from [115] with permission from Elsevier)
Fig. 6
Fig. 6
Summary of the sequential expression of P2X receptor mRNA and protein during neurogenesis in the rat brain. P2X receptors are arranged from top to bottom according to the chronological order of expression during rat brain development from E11 to adult. While P2X3 receptors appeared early, they declined in the stages that followed (represented by dotted line). P2X2 and P2X7 receptors were expressed from the same day (E14) onwards, while P2X4, P2X5, and P2X6 receptors were expressed from P1 onwards. Initial dotted line for P2X1 receptor represents unknown starting point, since expression of P2X1 receptor was not observed in any of the developmental ages examined in this study. (reproduced from [124] with permission from Wiley-Liss Inc.)
Fig. 7
Fig. 7
Chick embryo (day 14) ciliary ganglion cells: the inhibition of ATP-induced inward current by suramin. The neurons were pretreated with suramin of various concentrations for 2 min. In the upper panel the filled and open horizontal bars indicate the periods of application of ATP and suramin, respectively. In the lower panel, the responses in the presence of suramin are normalized to the peak current amplitude induced by 10 μM alone. Each point is the average of four neurons, and the vertical bars indicate standard error of the mean (reproduced from [139] with permission from Elsevier)
Fig. 8
Fig. 8
Effects of P2 receptor antagonists on the Ca2+ responses to ATP and UTP in embryonic (E3) chick neural retinas. A The effects of suramin (100 μM; A a) and Reactive blue 2 (50 μM; A b) on the response to 500 μM ATP. The records in the presence of suramin or Reactive blue were taken 7 min after changing the bath solutions to the antagonist-containing medium. The recovery controls (Wash) were taken after washing suramin for 7 min or Reactive blue for 25 min. The duration of ATP application (20 s) is indicated by the bars. All records were taken in the bath solutions containing 2.5 mM Ca2+. B The effects of suramin (100 μM; B a) and Reactive blue 2 (50 μM; B b) on the response to 200 μM UTP. The records in the presence of suramin or Reactive blue were taken 7 min after changing the bath solutions to the antagonist-containing medium. The recovery controls were taken after washing suramin for 7 min or Reactive blue for 15 min. The duration of UTP application (20 s) is indicated by the bars. All records were taken in the bath solutions containing 2.5 mM Ca2+ (reproduced from [151] with permission from John Wiley and Sons Ltd.)
Fig. 9
Fig. 9
Participation of purinergic receptors in neurogenesis of P19 embryonal carcinoma cells. a. Cell differentiation: In vitro differentiation of P19 embryonal carcinoma cells resembles processes occurring during early neuroectodermal differentiation. Stages of differentiation: Pluripotent P19 are treated with 1 μM retinoic acid in defined serum-free medium and cultured for 48 h in non-adherent flasks for formation of embryonic bodies as described previously [–248]. On the third day, embryonic bodies are collected and re-plated for neural differentiation to take place. Progenitor cells migrating from embryonic bodies express nestin, a specific marker for neural progenitors. Differentiation into neurons is complete on day 8 when cells reveal neuronal morphology, express β-3-tubulin and neuron-specific enolase (NEL) and form neuronal networks. Glial cells were eliminated from differentiating neuronal cultures by addition of cytosine–arabinoside [190]. b ATP-induced proliferation and differentiation. Prior to proliferation assays, P19 cells at the neural progenitor cell stage were kept in the absence or presence of the purinergic receptor antagonist PPADS (10 μM), cyclopiazonic acid (10 μM) for depletion of intracellular calcium pools or EGTA for chelating extracellular calcium (10 mM). Then 100 μM ATP was added and BrdU-incorporation was determined following 48 h of culture as a measure of cell proliferation. c Neural progenitors from day 4 of differentiation were incubated for 48 in the presence (+) or absence (−) of 100 μM ATP. Nestin, NEL and β-actin expression in cell extracts was determined by Western-blot analysis. (b and c are reproduced from [191] with permission from Elsevier)
Fig. 10
Fig. 10
Neurogenesis and phenotype determination of P19 cells involves sequential P2X and P2Y receptor activities. P19 embryonal carcinoma cells were induced to neuronal differentiation by addition of retinoic acid and embryonic body formation. Glial cells were eliminated from differentiating neuronal cultures by addition of cytosine-arabinoside [190]. Metabotropic P2Y1 and P2Y2 receptors, with a minor role of P2X4 receptors, participate in induction of proliferation of embryonic cells and embryonic body formation [191]. P2Y1, P2Y2, and P2X2 receptor activities are important for later differentiation and final phenotype determination, since, when these receptors were inhibited during P19 neurogenesis, no NMDA-glutamate and cholinergic receptor activities were detected in differentiated cells [190]. Neuronal-differentiated P19 cells express functional P2Y2 and P2X2 receptors
Fig. 11
Fig. 11
Purinergic P2X receptor subunit expression during in vitro neurogenesis of embryonic rat brain neural progenitor cells. A Cell differentiation: Neural stem and progenitor cells (NPC) are obtained by dissection of fetal rat telencephalon from embryonic day 14. NPC proliferation is maintained for 10 days in the presence of epidermal growth factor (EGF) and fibroblast growth factor 2 (FGF-2) for formation of neurospheres as clonal expansions of a single precursor cell (left panel, day 0). Neurogenesis is induced by removal of growth factors and plating in adherent cell culture dishes pre-coated with poly-l-lysine and laminin [193]. Neurosphere differentiation is complete following 7 days of induction. Cells migrate and differentiate into neurons and glial cells (panels from left to right: cell nuclei staining by 4′,6′-diamidino-2-phenylindole (DAPI); neuronal and astroglial differentiation detected by immunofluorescence staining against β-3-tubulin and glial fibrillary acidic protein, respectively). b Changes of P2X receptor expression in NPC induced to neurogenesis by growth factor deprivation. Following neurosphere expansion, half of the population was kept for 7 days in complete culture containing EGF and FGF-2 (Control group—Ctr NPC), while the other half was maintained in the absence of growth factors for induction of neurogenesis (EFless NPC). Gene expression of P2X1–P2X6 receptor subunits in Ctr and EFless NPC was determined by real-time PCR. Relative gene expression levels were obtained by comparing them to glyceraldehyde-3-phosphate dehydrogenase (GAPDH) levels, which are not supposed to vary under the chosen experimental conditions. Increased neurogenesis was accompanied by elevated P2X2 and P2X6 receptor subunit expression (*p < 0.05, determined by Student′s t test) (b reproduced from [195], with permission from Springer)

Similar articles

Cited by

References

    1. Burnstock G. Physiology and pathophysiology of purinergic neurotransmission. Physiol Rev. 2007;87:659–797. - PubMed
    1. Kupitz Y, Atlas D. A putative ATP-activated Na + channel involved in sperm-induced fertilization. Science. 1993;261:484–486. - PubMed
    1. Smith R, Koenig C, Pereda J. Adenosinetriphosphatase (Mg-ATPase) activity in the plasma membrane of preimplantation mouse embryo as revealed by electron microscopy. Anat Embryol (Berl) 1983;168:455–466. - PubMed
    1. Ishikawa T, Seguchi H. Localization of Mg++-dependent adenosine triphosphatase and alkaline phosphatase activities in the postimplantation mouse embryos in day 5 and 6. Anat Embryol (Berl) 1985;173:7–11. - PubMed
    1. Foresta C, Rossato M, Di Virgilio F. Extracellular ATP is a trigger for the acrosome reaction in human spermatozoa. J Biol Chem. 1992;267:1–5. - PubMed

Substances

LinkOut - more resources