

Optimal gating compared to 3D and 4D PET reconstruction for characterization of lung tumours
- PMID: 21222120
- PMCID: PMC3070073
- DOI: 10.1007/s00259-010-1716-6
Optimal gating compared to 3D and 4D PET reconstruction for characterization of lung tumours
Abstract
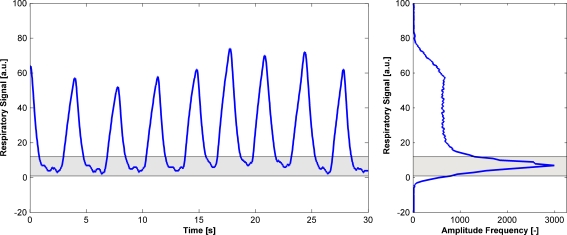
Purpose: We investigated the added value of a new respiratory amplitude-based PET reconstruction method called optimal gating (OG) with the aim of providing accurate image quantification in lung cancer.
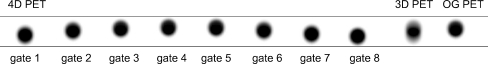
Methods: FDG-PET imaging was performed in 26 lung cancer patients during free breathing using a 24-min list-mode acquisition on a PET/CT scanner. The data were reconstructed using three methods: standard 3D PET, respiratory-correlated 4D PET using a phase-binning algorithm, and OG. These datasets were compared in terms of the maximum SUV (SUVmax) in the primary tumour (main endpoint), noise characteristics, and volumes using thresholded regions of SUV 2.5 and 40% of the SUVmax.
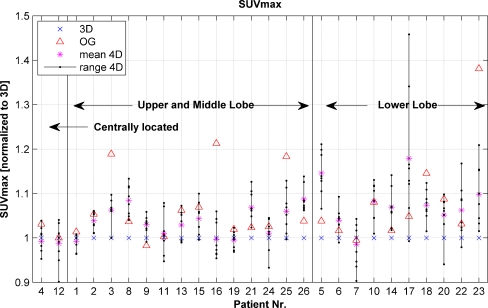
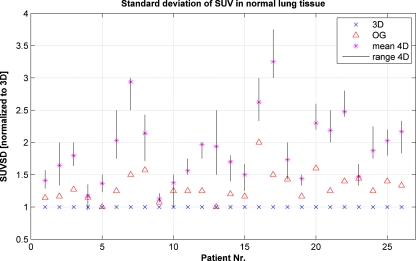
Results: SUVmax values from the 4D method (13.7 ± 5.6) and the OG method (14.1 ± 6.5) were higher (4.9 ± 4.8%, p < 0.001 and 6.9 ± 8.8%, p < 0.001, respectively) than that from the 3D method (13.1 ± 5.4). SUVmax did not differ between the 4D and OG methods (2.0 ± 8.4%, p = NS). Absolute and relative threshold volumes did not differ between methods, except for the 40% SUVmax volume in which the value from the 3D method was lower than that from the 4D method (-5.3 ± 7.1%, p = 0.007). The OG method exhibited less noise than the 4D method. Variations in volumes and SUVmax of up to 40% and 27%, respectively, of the individual gates of the 4D method were also observed.
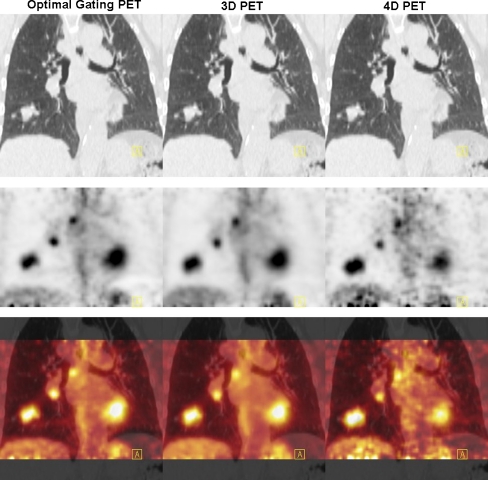
Conclusion: The maximum SUVs from the OG and 4D methods were comparable and significantly higher than that from the 3D method, yet the OG method was visibly less noisy than the 4D method. Based on the better quantification of the maximum and the less noisy appearance, we conclude that OG PET is a better alternative to both 3D PET, which suffers from breathing averaging, and the noisy images of a 4D PET.
Figures

References
-
- Aerts HJ, van Baardwijk AA, Petit SF, Offermann C, Loon J, Houben R, et al. Identification of residual metabolic-active areas within individual NSCLC tumours using a pre-radiotherapy (18)Fluorodeoxyglucose-PET-CT scan. Radiother Oncol. 2009;91:386–392. doi: 10.1016/j.radonc.2009.03.006. - DOI - PMC - PubMed
-
- van Baardwijk A, Bosmans G, Dekker A, van Kroonenburgh M, Boersma L, Wanders S, et al. Time trends in the maximal uptake of FDG on PET scan during thoracic radiotherapy. A prospective study in locally advanced non-small cell lung cancer (NSCLC) patients. Radiother Oncol. 2007;82:145–152. doi: 10.1016/j.radonc.2007.01.007. - DOI - PubMed
-
- van Baardwijk A, Bosmans G, Boersma L, Buijsen J, Wanders S, Hochstenbag M, et al. PET-CT-based auto-contouring in non-small-cell lung cancer correlates with pathology and reduces interobserver variability in the delineation of the primary tumor and involved nodal volumes. Int J Radiat Oncol Biol Phys. 2007;68:771–778. doi: 10.1016/j.ijrobp.2006.12.067. - DOI - PubMed
MeSH terms
Substances
LinkOut - more resources
Full Text Sources
Other Literature Sources
Medical
Miscellaneous
