. 2011 Jan;178(1):150-60.
doi: 10.1016/j.ajpath.2010.11.041. Epub 2010 Dec 23.

Tissue eosinophilia in a mouse model of colitis is highly dependent on TLR2 and independent of mast cells

Affiliations

Tissue eosinophilia in a mouse model of colitis is highly dependent on TLR2 and independent of mast cells

Eric J Albert et al. Am J Pathol. 2011 Jan.

Abstract

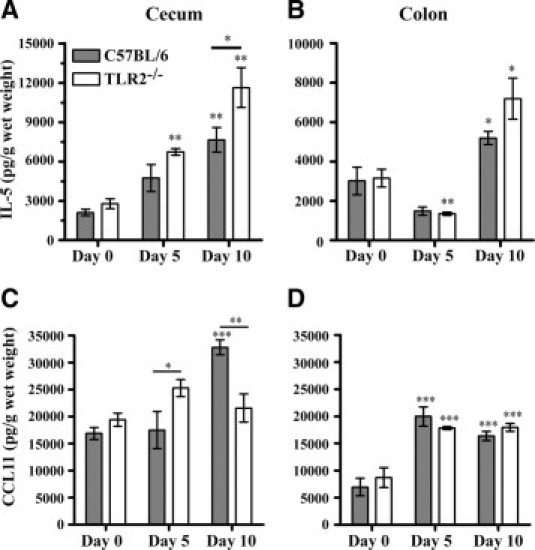
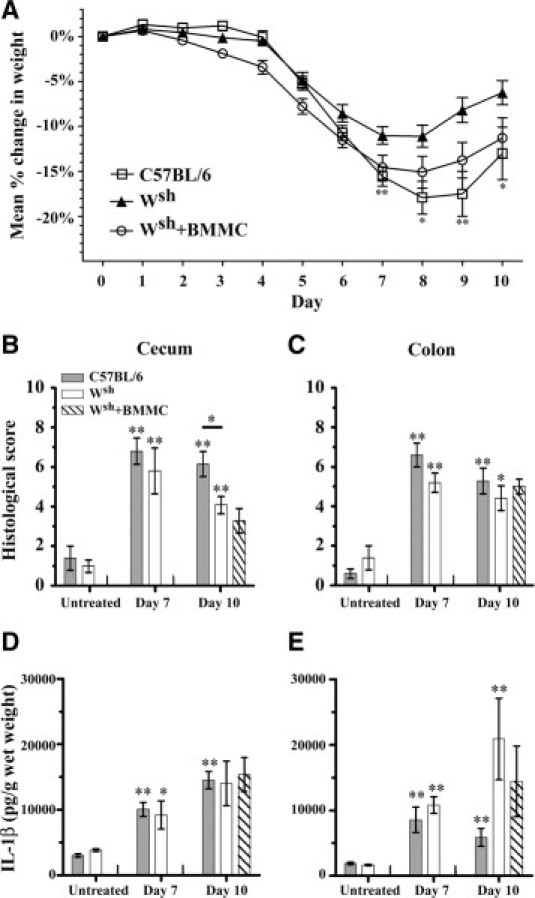
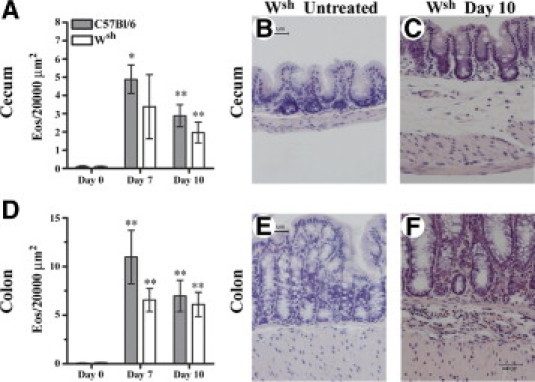
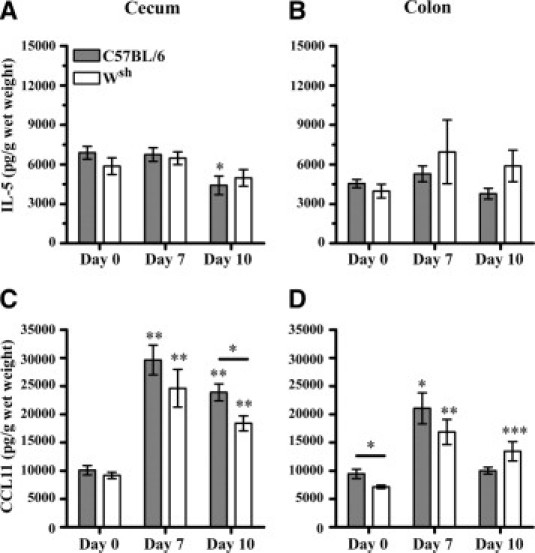
The mechanisms initiating eosinophil influx into sites of inflammation have been well studied in allergic disease but are poorly understood in other settings. This study examined the roles of TLR2 and mast cells in eosinophil accumulation during a nonallergic model of eosinophilia-associated colitis. TLR2-deficient mice (TLR2(-/-)) developed a more severe colitis than wild-type mice in the dextran sodium sulfate (DSS) model. However, they had significantly fewer eosinophils in the submucosa of the cecum (P < 0.01) and mid-colon (P < 0.01) than did wild-type mice after DSS treatment. Decreased eosinophilia in TLR2(-/-) mice was associated with lower levels of cecal CCL11 (P < 0.01). Peritoneal eosinophils did not express TLR2 protein, but TLR2 ligand injection into the peritoneal cavity induced local eosinophil recruitment, indicating that TLR2 activation of other cell types can mediate eosinophil recruitment. After DSS treatment, mast cell-deficient (Kit(W-sh/W-sh)) mice had similar levels of intestinal tissue eosinophilia were observed as those in wild-type mice. However, mast cell-deficient mice were partially protected from DSS-induced weight loss, an effect that was reversed by mast cell reconstitution. Overall, this study indicates a critical role for indirect TLR2-dependent pathways, but not mast cells, in the generation of eosinophilia in the large intestine during experimental colitis and has important implications for the regulation of eosinophils at mucosal inflammatory sites.


Figures

Figure 1
Figure 1
TLR2−/− mice have reduced eosinophil numbers in the large intestine after DSS treatment. TLR2−/− and wild-type C57BL/6 mice were treated with 3% DSS (w/v) for 5 days followed by 5 days of regular drinking water. Eosinophils (Eos) were counted in the submucosa in 10 random fields of Congo Red-stained cecal (A) and mid-colonic (D) tissue sections from each mouse. Values are pooled means ± SEM of 5–10 mice per time point from two separate experiments. Significance is denoted as **P < 0.01, and ***P < 0.001. Unless indicated by a line showing a specific additional comparison, significance denotes increase compared with day 0 values for the same type of mouse. B, C: Hematoxylin and eosin stained cecal sections at ×400 magnification showing the severity of disease and eosinophils in the submucosa in C57BL/6 and TLR2−/− mice, respectively. E, F: Hematoxylin and eosin stained mid-colonic sections at ×400 magnification showing the severity of disease and the presence of eosinophils in the submucosa. G: Representative Congo Red staining for eosinophils used to count eosinophils in the submucosa at ×1000 magnification. H: Detail from a boxed area. G, showing eosinophil-specific Congo Red staining.
Figure 2
Figure 2
TLR2−/− mice have reduced levels of eosinophil chemoattractants in the large intestine after dextran sodium sulfate (DSS) treatment. TLR2−/− and wild-type C57BL/6 mice received 3% DSS in drinking water for 5 days, followed by 5 days of regular water. Tissue samples were ultrasonicated and supernatants were assayed for total tissue interleukin-5 (IL-5) and eotaxin levels using enzyme-linked immunosorbent assay (ELISA). Values are means ± SEM of 5–6 mice per time point. Significance is denoted as *P < 0.05, **P < 0.01, and ***P < 0.001. Except where a specific additional comparison between groups is indicated by a line, significance in day 5 and day 10 groups shown is based on a comparison with the illustrated baseline (day 0) values from the same type of mouse.
Figure 3
Figure 3
Mast cell-deficient mice are less susceptible to DSS-induced weight loss and colitis in the cecum. Mast cell-deficient (Wsh), wild-type C57BL/6, and Wsh mice mast reconstituted intravenously with 7.5 × 10⁶ C57BL/6 bone marrow-derived mast cells (Wsh + BMMC) received 3% DSS in drinking water for 5 days, followed by 2 (n = 5) or 5 days (n = 9–12) of regular water. A: Percent weight change of C57BL/6 and Wsh mice. Values are means ± SEM. B, C: Histological assessment of disease activity in H&E-stained tissue sections from the cecum (B) and mid-colon (C) before (n = 5) and after (n = 5–12 per group) DSS administration. Values are means ± SEM. Scoring was as described under Materials and Methods. Cecal and mid-colonic tissue samples were removed and ultrasonicated, and supernatants were assayed for total tissue IL-1β (D, E) levels using ELISA. Values are means ± SEM of 5–12 mice per time point. Significance compared with baseline (day 0) values for each group of mice is denoted as *P < 0.05 and **P < 0.01.
Figure 4
Figure 4
Mast cells do not play a significant role in eosinophil recruitment to the large intestine during DSS colitis. Mast cell-deficient (Wsh) and wild-type C57BL/6 mice received 3% DSS in drinking water for 5 days, followed by 2 or 5 days of regular water. Eosinophils (Eos) were counted at ×1000 magnification in the submucosa of Congo Red-stained cecal (A) and mid-colonic (D) tissue sections. Values are means ± SEM of 5–12 mice per time point. Significance compared with untreated (day 0) animals of the same type is denoted as *P < 0.05 and **P < 0.01. Representative photomicrographs (×400 magnification) of Congo Red-stained cecal sections from untreated (B) and day 10 (C) Wsh mice and of Congo Red-stained mid-colonic sections from untreated (E) and day 10 (F) Wsh mice.
Figure 5
Figure 5
Mast cells do not play a role in regulating IL-5 or eotaxin levels in the large intestine during DSS colitis. Mast cell-deficient (Wsh) and wild-type C57BL/6 mice received 3% DSS in drinking water for 5 days, followed by 2 or 5 days of regular water. Cecal and mid-colonic tissue samples were removed and ultrasonicated, and supernatants were assayed for total tissue IL-5 (A, B) and CCL11 (C, D) levels using ELISA. Note much larger and sustained CCL11 responses in cecal tissue than in colonic tissue. Values are means ± SEM of 5–12 mice per time point pooled from 2 to 3 experiments per group. Except where indicated by a comparison line, significance compared with appropriate baseline (day 0) animals is denoted as *P < 0.05, **P < 0.01, and ***P < 0.001.
Figure 6
Figure 6
Eosinophils do not express TLR2, but are recruited to the peritoneum by TLR2 agonist treatment. A: Resident peritoneal cells were harvested from wild-type mice and analyzed by fluorescence-activated cell sorting (FACS) for the expression of TLR2 on eosinophils (Eos) or macrophages (Mϕ). TLR2 expression is indicated by open profiles, with shading for isotype controls. Electronic gating to identify eosinophils and macrophages was based on forward and side scatter followed by selection of either Siglec-F+ (Eos) or CD11bhi (Mϕ) cells. B: The TLR2 agonist FSL-1 (1 μg) or saline was injected i.p. into C57BL/6 mice. After 16 hours, the number of eosinophils in the peritoneum was determined based on the total number of peritoneal cells and the percentage of Siglec-F+ cells observed by FACS analysis. Values are means ± SEM of 11–12 mice per treatment. Significance compared with the saline-treated group is denoted as *P < 0.05.

References

    1. Xavier R.J., Podolsky D.K. Unravelling the pathogenesis of inflammatory bowel disease. Nature. 2007;448:427–434. - PubMed
    1. Rothenberg M.E., Mishra A., Brandt E.B., Hogan S.P. Gastrointestinal eosinophils. Immunol Rev. 2001;179:139–155. - PubMed
    1. King T., Biddle W., Bhatia P., Moore J., Miner P.B., Jr Colonic mucosal mast cell distribution at line of demarcation of active ulcerative colitis. Dig Dis Sci. 1992;37:490–495. - PubMed
    1. Nishida Y., Murase K., Isomoto H., Furusu H., Mizuta Y., Riddell R.H., Kohno S. Different distribution of mast cells and macrophages in colonic mucosa of patients with collagenous colitis and inflammatory bowel disease. Hepatogastroenterology. 2002;49:678–682. - PubMed
    1. Weller P.F. Eosinophils: structure and functions. Curr Opin Immunol. 1994;6:85–90. - PubMed

Publication types

MeSH terms