Review
. 2011 Apr 15;589(Pt 8):1893-903.
doi: 10.1113/jphysiol.2010.202184. Epub 2011 Jan 10.

Hippocampal microcircuit dynamics probed using optical imaging approaches

Affiliations
Review

Hippocampal microcircuit dynamics probed using optical imaging approaches

Douglas A Coulter et al. J Physiol. .

Abstract

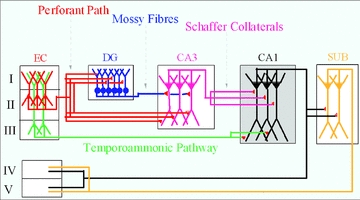
Mammalian cortical structures are endowed with the capacity for plasticity, which emerges from a combination of the dynamics of circuit connectivity and function, and the intrinsic function of the neurons within the circuit. However, this capacity is accompanied by a significant risk: the capability to generate seizure discharges is also a property of all mammalian cortices. How do cortical circuits reconcile the requirement to maintain plasticity, but at the same time control seizure initiation? These issues come into particular focus in the hippocampus. The hippocampus is one of the main plasticity engines in the brain, and is also a structure frequently implicated in the generation of epileptic seizures, with temporal lobe epilepsy constituting the most prevalent form of epilepsy in the adult population. One aspect of hippocampal circuitry that is particularly prominent is its intimate interconnections with the entorhinal cortex. These interconnections create a number of excitatory synaptic loops within the limbic system, which, in addition to being important in cognitive function, can support reentrant activation and seizure generation. In the present review, using optical imaging approaches to elucidate circuit processing at high temporal and spatial resolution, we examine how two targets of entorhinal cortical input within the hippocampus, the dentate gyrus and area CA1, regulate these synaptic pathways in ways that can maintain functions important in generation of normal activity patterns, but that dampen the ability of these inputs to generate seizure discharges.


Figures

Figure 1
Figure 1. Circuit schematic diagram of entorhinal/hippocampal synaptic pathways
Inputs from the entorhinal cortex (EC) to hippocampus include the perforant path, originating from layer II EC neurons, and the temporoammonic pathway, originating from layer III EC neurons. These innervate the dentate gyrus (DG) and area CA1, respectively. Projections from these two structures create long (EC–DG–CA3–CA1–EC) and short (EC–CA1–EC) excitatory synaptic loops.
Figure 2
Figure 2. Dentate gyrus activation by perforant path stimulation, and filtering defined as lack of relay to CA3
A, left, greyscale image of a hippocampal entorhinal cortical slice, together with a region of interest (ROI) delineation for recordings in A (white box), and in B (blue and yellow ROIs for dentate and CA3 traces in B). The cartoon dentate granule cell depicts the composition of the various layers in the voltage sensitive dye (VSD) imaging depictions in A, corresponding to the white box. The molecular layer is depicted, onto which the VSD recordings at varying time points post-stimulation (2–7 ms) are projected. At early time points (4 and 5 ms), the outer molecular layer (OML) activates, and this activation rapidly propagates down the dendrites (inner molecular layer, IML) to the cell body layer (DG) (note complete activation of the dentate gyrus by 7 ms post-stimulus). Perforant path activation rapidly activates the entire dendritic tree of dentate granule cells. B, larger area image of activation of the dentate gyrus and area CA3 by perforant path activation. Note that, both at the peak of the DG response (7 ms) and at later time points, little or no CA3 activation is evident. This is also illustrated in the VSD traces in C, where the integrated response in the DG and CA3 ROIs depicted in the top left panel of A are plotted vs. time. Note the robust activation of the dentate gyrus, which generates little or no response in CA3. Perforant path inputs, although robust, are filtered by the dentate gyrus and are ineffective in activating area CA3. Unpublished data of Yue and Coulter.
Figure 3
Figure 3. Feedforward GABAA-mediated inhibition activated via TA pathway stimulation spatially restricts evoked EPSPs to the distal dendrites of the CA1 pyramidal neurons
A, control. A snapshot of activation at 30 ms of the VSD responses of evoked EPSPs (denoted by asterisk) to stimulation in stratum lacunosum moleculare (left) and the activation profile (right) generated from the raster line scan along the path of interest (green line). The location of the patch recording electrode is denoted by the electrode graphic. Top trace (I-clamp, current clamp recording), whole-cell recording trace from the apical dendrite of a CA1 pyramidal cell in stratum radiatum. VSD SO, SR, and SLM are the local VSD signals quantified from regions of interest in stratum oriens (blue box), stratum radiatum (green box), and stratum lacunosum moleculare (black box). Note that the TA-evoked EPSP is spatially restricted to the extreme distal dendrites of CA1 pyramidal neurons. B, effects of the GABAA and GABAB antagonists gabazine (1 μm) and CGP 55845A (2 μm). Left, snapshot at 40 ms. Note that GABAergic inhibition blockade results in loss of spatial segregation of the TA EPSPs in stratum lacunosum moleculare and significant propagation of TA EPSPs to stratum radiatum and stratum oriens. C, plot of dendritic whole-cell recording responses along the dendrites of the CA1 pyramidal neuron, as a function of the normalized distance of the patch electrode from the hippocampal fissure to stratum pyramidale. Insets show the relative current-clamp dendritic specimen records and locations of the patch electrode. Note that TA-evoked IPSPs are prevalent in recordings close to the cell somata, whereas EPSPs are recorded from more distal dendritic sites. D, CA1 schematic showing the response to TA stimulation. Red represents excitation and blue represents inhibition. SC, Schaffer collateral; TA, temporoammonic pathway; PC, pyramidal cell; O-LM, oriens–lacunosum moleculare interneuron; BiC, bistratified cell; Bas, basket cell; Chandelier, chandelier cell; IN, interneuron. From Ang et al. (2005), with permission from the Society for Neuroscience.
Figure 4
Figure 4. Feedback inhibition further constrains TA EPSP activation
A, CA1 VSD snapshot at the peak of the EPSP response (red, 30 ms) to burst stimulus to the TA input pathway. VSD SR and SLM are the local VSD signals quantified from regions of interest in stratum radiatum (green box) and stratum lacunosum moleculare (black box), respectively. B, snapshot at the peak (35 ms) of the alvear stimulation-evoked response, an IPSP (blue). The alveus was activated with a burst stimulation to recruit O-LM feedback interneurons. C, alvear and TA stimulation. The alvear and TA activation are paired so the alvear burst stimulus precedes the TA stimulus by 5 ms, corresponding to recruitment of feedback inhibition. The snapshot depicts activation at 35 ms. Note that the TA EPSP in stratum lacunosum moleculare is completely suppressed. D, comparison of the VSD signals quantified from stratum radiatum (top) and stratum lacunosum moleculare (bottom) for TA stimulation, and alvear and TA stimulation. E, summary data on the suppression of TA EPSPs by distally targeted inhibition. Note the suppression of TA EPSPs in SLM (ANOVA, **P≤ 0.05, n = 4). Unpublished data of Ang and Coulter.
Figure 5
Figure 5. Circuit integration: paired activation of Schaffer collaterals at a half-theta interval gates TA EPSPs
A–C, current-clamp (I-clamp) dendritic recording traces derived from whole-cell recordings from the apical dendrite of a CA1 pyramidal cell in response to a single stimulus applied in stratum radiatum Schaffer (SC) pathway (A), burst stimulation of the TA pathway (B), and sequential activation of the SC and TA pathways at a 40 ms interval (C). Note the de novo appearance of a TA-mediated EPSP during sequential stimulation. D–F, top traces: VSD SO, SR and SLM are the local VSD signals quantified from regions of interest in stratum oriens, stratum radiatum, and stratum lacunosum moleculare, respectively. Bottom plot, activation profile, generated from a raster line scan along the dendritic axis of CA1, which depicts the spatiotemporal response to a Schaffer collateral stimulus (D). Note the short, powerful EPSP (red) followed by an IPSP (blue; see current clamp response in A). E, raster plot of response to TA pathway stimulation. Note that the VSD response is spatially restricted to the apical tuft in stratum lacunosum moleculare, and the current-clamp dendritic recording of a CA1 pyramidal neuron apical dendrite in stratum radiatum shows an inhibitory response (B). F, sequential Schaffer–TA (SC&TA) pathway stimulation. The Schaffer and TA stimuli are paired so that a single Schaffer stimulus precedes the TA burst stimulus by 40 ms. With the previous Schaffer stimulus, the TA inputs integrate synergistically and propagate to stratum radiatum and stratum oriens (note red TA activation extending to SR and SO, also note EPSP appearance in C). The asterisk denotes gating of temporoammonic EPSPs to stratum radiatum and stratum oriens. Modified from Ang et al. 2005, with permission from the Society for Neuroscience.
Figure 6
Figure 6. Excitation evoked by activation of the TA pathway is increased by an order of magnitude in area CA1 of epileptic animals
A, hippocampal schematic diagram illustrating the major afferent pathways to the hippocampus and the position of the stimulation electrode that is used to activate the TA pathway (stim.). The blue area indicates typical area imaged with our camera. B, VSD recording snapshots of control and epileptic responses at varying time points during the response to a burst stimulation applied to the TA pathway at the angular bundle. This stimulus produces spatially restricted TA activity in control. In contrast, in epileptic tissue, excitation is propagated throughout the stratum radiatum and pyramidale. This is demonstrated in C by comparing the percentage of the total CA1 area activated by TA stimulation in control (grey) and epileptic (black) plotted against time. Pixels showing depolarizations of ≥0.05%ΔF/F for control and ≥0.035%ΔF/F for epileptic are counted, normalized to the total CA1 area imaged, and computed as percentage area activated. Different ΔF/F scales were used in the two conditions because of the higher background fluorescence evident in epileptic tissue, probably due to gliosis. Computing percentage area activated using identical ΔF/F scales did not alter the findings (dotted line in C corresponds to data from epileptic slice computed at ≥0.05%ΔF/F). This reveals a greater area and prolonged period of activation in epileptic tissue compared with controls; inset traces depicting percentage change in fluorescence shows that this is caused in part by loss of inhibition, with an IPSP present in the stratum radiatum (SR) in control animals, which is transformed into an EPSP in epileptic animals. The dashed lines correspond to the time points illustrated in B. D, summary data illustrate the differences in both peak amplitude and time course of area activated for control (grey) compared against epileptic (black) for varying time points. An asterisk indicates that epileptic animals demonstrate a significant increase in the maximum area activated by temporoammonic stimulation over control for the selected time points. E, these results can be summarized as a simple comparison by integrating the area under the percentage pixel activated traces, capturing both the number and duration of pixels activated, which illustrates a 10-fold increase in activation in slices from epileptic animals compared with controls (ANOVA, *P≤ 0.05; n = 12). PP, perforant path; DG, dentate gyrus; TA, temporoammonic pathway; EC, entorhinal cortex. From Ang et al. 2006, with permission from the Society for Neuroscience.

References

    1. Acsady L, Kamondi A, Sik A, Freund TF, Buzsaki G. GABAergic cells are the major postsynaptic targets of mossy fibers in the rat hippocampus. J Neurosci. 1998;18:3386–3403. - PMC - PubMed
    1. Ang CW, Carlson G, Coulter DA. Hippocampal CA1 circuitry dynamically gates direct cortical inputs preferentially at theta frequencies. J Neurosci. 2005;25:9567–9580. - PMC - PubMed
    1. Ang CW, Carlson GC, Coulter DA. Massive and specific dysregulation of direct cortical input to the hippocampus in temporal lobe epilepsy. J Neurosci. 2006;6:11850–11856. - PMC - PubMed
    1. Brooks-Kayal AR, Shumate MD, Hong Y, Rikhter TY, Coulter DA. Selective changes in single cell GABAA receptor subunit expression correlate with altered function in epileptic hippocampus. Nat Med. 1998;4:1166–1172. - PubMed
    1. Brun VH, Otnaess MK, Molden S, Steffenach HA, Witter MP, Moser MB, Moser EI. Place cells and place recognition maintained by direct entorhinal-hippocampal circuitry. Science. 2002;296:2243–2246. - PubMed

MeSH terms

LinkOut - more resources