. 2011 Mar 1;589(Pt 5):1159-72.
doi: 10.1113/jphysiol.2010.203224. Epub 2011 Jan 10.

Astrocytes control GABAergic inhibition of neurons in the mouse barrel cortex

Affiliations

Astrocytes control GABAergic inhibition of neurons in the mouse barrel cortex

B Benedetti et al. J Physiol. .

Abstract

Astrocytes in the barrel cortex respond with a transient Ca2+ increase to neuronal stimulation and this response is restricted to the stimulated barrel field. In the present study we suppressed the astrocyte response by dialysing these cells with the Ca2+ chelator BAPTA. Electrical stimulation triggered a depolarization in stellate or pyramidal ‘regular spiking' neurons from cortex layer 4 and 2/3 and this response was augmented in amplitude and duration after astrocytes were dialysed with BAPTA. Combined blockade of GABAA and GABAB receptors mimicked the effect of BAPTA dialysis, while glutamate receptor blockers had no effect. Moreover, the frequency of spontaneous postsynaptic currents was increased after BAPTA dialysis. Outside the range of BAPTA dialysis astrocytes responded with a Ca2+ increase, but in contrast to control, the response was no longer restricted to one barrel field. Our findings indicate that astrocytes control neuronal inhibition in the barrel cortex.


Figures

Figure 1
Figure 1. Astrocytic Ca2+ chelation causes an enhanced evoked response in neurons
A, membrane potential (Em) recording from a neuron within the stimulated barrel. Stimulus-evoked neuronal response before (Control, left) and after dialysis of an astrocyte with BAPTA (right). The stimulation is indicated by the bar. B, mean stimulus (STM) evoked depolarization amplitude (left, STM depol), time for half-repolarization (middle, ‘half-rep’) and integral of the voltage trace (ISTM) during the evoked depolarization (right). *P= 0.002, **P < 0.001 (unpaired t test).
Figure 2
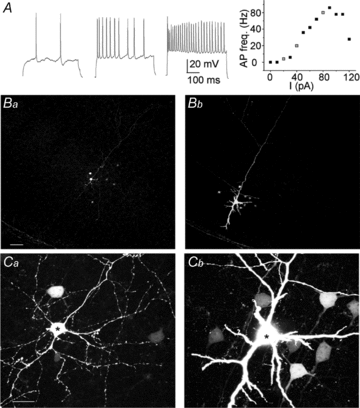
Figure 2. Selected neurons had physiological and morphological features of spiny stellate and pyramidal cells
A, cells were depolarized for 500 ms with increasing current steps. Three sample traces of membrane potential recording are shown. On the right a plot describes the relation between injected current amplitude and action potential frequency. Dots in grey were obtained from the three sample recordings. B, L4 (a) and L2/3 (b) neurons dialysed with biocytin added to pipette solution. Scale bar denotes 150 μm. C, same cells as in B at higher magnification (scale bar 20 μm). Note the coupled cells in L4 (a) and L2/3 (b); the patched cell is marked by an asterisk.
Figure 3
Figure 3. Inhibiting GABAA and GABAB receptors increased the stimulation-induced depolarization of neurons
A, membrane potential (Em) recording during stimulation (indicated by bar) in control (left trace) and in the presence of gabazine (middle trace). The graph on the right gives the mean stimulus induced depolarization (white column), half-repolarization time (grey column) and ISTM (black column) from Control (right trace) normalized to the control response as 100% (drug/Control). B and C, similarly CGP55845 (B) and a combination of gabazine and CGP55845 (C) were tested. *P < 0.05, **P < 0.01, ***P < 0.001 (paired t test of related parametric values).
Figure 4
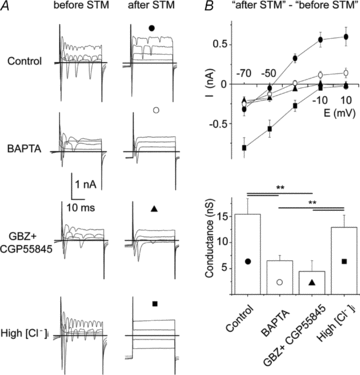
Figure 4. Reversal potential and membrane conductance are similarly affected by GABA receptors blockage and astrocytic BAPTA dialysis
A, currents in response to depolarizing voltage steps (−50 mV, −30 mV, −10 mV and +10 mV) from a holding potential of −70 mV were recorded in whole cell voltage clamp. Recordings were obtained before and after the stimulation with the external electrode in control conditions (upper left, •), after astrocytic BAPTA dialysis (upper right, ◯), after gabazine + CGP55845 bath application (lower left, ▴) and after dialysis of the neuron with high chloride concentration (high [Cl]i) (lower right, ▪). Scale bar: 0.5 nA, 0.1 s. B, average current–voltage relation of the stimulus evoked conductance under the four conditions as described in A is shown at the top. Average conductance determined between −10 and −70 mV is displayed at the bottom for the four conditions described in A. **P= 0.002, one-way ANOVA.
Figure 5
Figure 5. Astrocytic Ca2+ chelation, GABA receptor blockage or dialysis with high [Cl] reverses a stimulation induced hyperpolarization into depolarization
A, neurons were depolarized by current injection to about −40 mV while recording membrane potential (Em). The stimulation protocol was applied as indicated by bar. In the upper three traces cells were dialysed with low [Cl], in the bottom two with high [Cl] in the pipette. The control response (Control) was before BAPTA dialysis, and BAPTA indicates that the neuron was close to an astrocyte dialysed with BAPTA. In the middle trace, gabazine + CGP55845 was applied. The lower traces show a recording from neurons dialysed with high [Cl] before and after astrocyte BAPTA dialysis. In control conditions, the membrane hyperpolarized after stimulation, while in all other conditions we observed a depolarization (scale bar = 1 s). B, average hyperpolarization in control (Control) and average depolarization after astrocyte BAPTA dialysis (BAPTA), GABAA and GABAB receptor blockade (Gabazine + CGP55845), 132 mm[Cl] inside the patched neuron before (High [Cl]i) and after astrocytic BAPTA dialysis (High [Cl]i+ BAPTA). **P < 0.01, ***P < 0.001, one-way ANOVA.
Figure 6
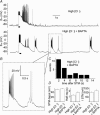
Figure 6. Neurons dialysed with high [Cl] show spontaneous depolarizing events in the vicinity of a BAPTA filled astrocyte
A, stimulation (indicated by bar) induced a depolarization in a neuron dialysed with high chloride concentration before (high [Cl]i) and after astrocytic (High [Cl]i+ BAPTA) dialysis. B, a spontaneous depolarizing event shown in A is displayed with higher time resolution. C, time histogram of spontaneous occurring depolarizations after electrical stimulation (time point 0). Note that most events occurred between 2 and 4 s after the stimulation. D, as described in Fig. 1, average stimulus (STM) evoked depolarization (left, STM depol), time for half-repolarization (middle, ‘half-rep’) and integral of the voltage trace (ISTM) during the evoked depolarization (right) in high [Cl]i and after BAPTA dialysis.
Figure 7
Figure 7. BAPTA dialysis of astrocytes eliminated locally the Ca2+ increase to stimulation, but a larger population of astrocytes was activated at a distance
A, fluorescence image at the peak of the Ca2+ response after stimulation before (Control) and after dialysis of an astrocyte with BAPTA. The borders of the barrel columns are indicated by lines. Scale bar denotes 100 μm. The fluorescence recordings were obtained from three regions of interest and are displayed in the middle. Within the region of interest (ROI) 1 the Ca2+ evoked response is suppressed, ROI 2 shows an unaffected Ca2+ response after the BAPTA dialysis, astrocytes in ROI 3 are newly recruited after BAPTA dialysis. B, spatial distribution of brightness from the figures in A ranging from low (dark grey) to medium (orange) and to high (magenta) values. C, average area covered by responding astrocytes before (Control) and 45 to 60 min of BAPTA dialysis (±s.e.m.). We also did the experiment without BAPTA dialysis. Control1 is the control, Control2 a recording after waiting for 45–60 min. **P= 0.01, one-way ANOVA.
Figure 8
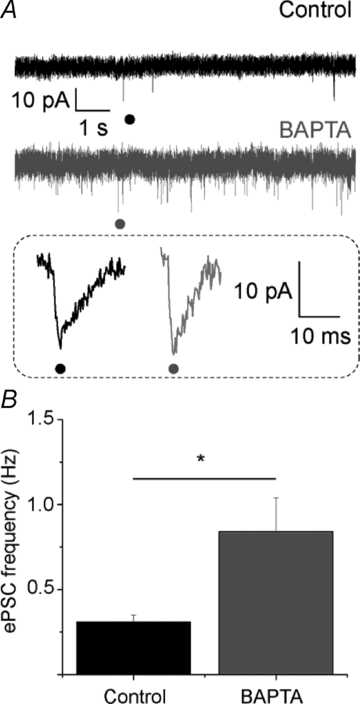
Figure 8. Astrocytic calcium chelation increased the frequency of spontaneous excitatory post synaptic current (ePSC)
A, ePSCs of a voltage clamp recording with a holding potential equal to −70 mV in control (black) and after astrocytic Ca2+ chelation (grey). Single events (•) are displayed at higher magnification in the framed quadrant below. B, ePSC frequency is significantly increased after astrocytic calcium chelation (unpaired t test, *P= 0.01).

References

    1. Agmon A, Connors BW. Thalamocortical responses of mouse somatosensory (barrel) cortex in vitro. Neuroscience. 1991;41:365–379. - PubMed
    1. Agmon A, Connors BW. Correlation between intrinsic firing patterns and thalamocortical synaptic responses of neurons in mouse barrel cortex. J Neurosci. 1992;12:319–329. - PMC - PubMed
    1. Agulhon C, Fiacco TA, McCarthy KD. Hippocampal short- and long-term plasticity are not modulated by astrocyte Ca2+ signaling. Science. 2010;327:1250–1254. - PubMed
    1. Andersson M, Hanse E. Astrocytes impose postburst depression of release probability at hippocampal glutamate synapses. J Neurosci. 2010;30:5776–5780. - PMC - PubMed
    1. Bacci A, Sancini G, Verderio C, Armano S, Pravettoni E, Fesce R, Franceschetti S, Matteoli M. Block of glutamate-glutamine cycle between astrocytes and neurons inhibits epileptiform activity in hippocampus. J Neurophysiol. 2002;88:2302–2310. - PubMed

Publication types

MeSH terms

LinkOut - more resources