. 2011 Mar;155(3):1158-68.
doi: 10.1104/pp.110.169391. Epub 2011 Jan 11.

A three-dimensional multiscale model for gas exchange in fruit

Affiliations

A three-dimensional multiscale model for gas exchange in fruit

Quang Tri Ho et al. Plant Physiol. 2011 Mar.

Abstract

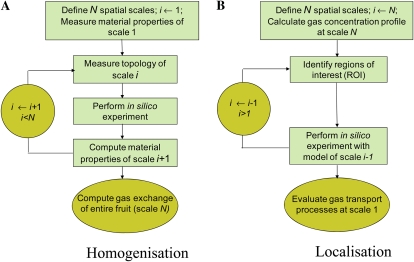
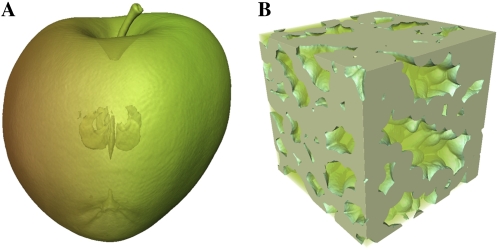
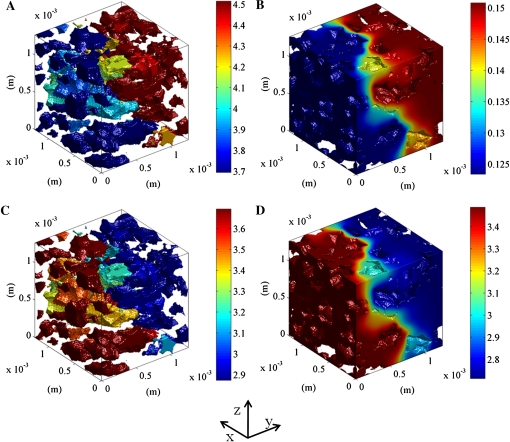
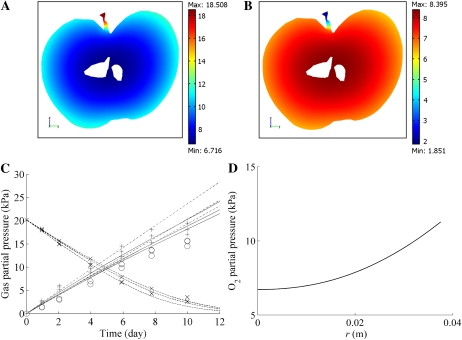
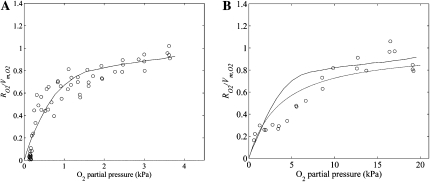
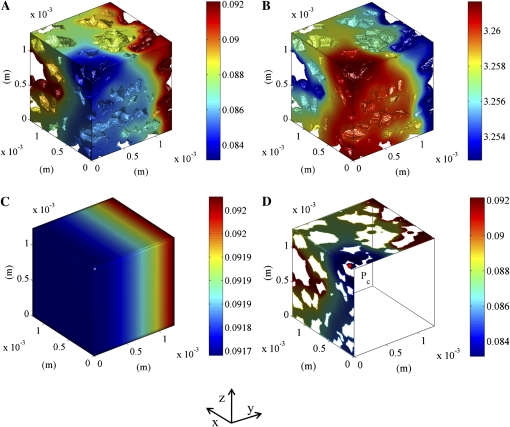
Respiration of bulky plant organs such as roots, tubers, stems, seeds, and fruit depends very much on oxygen (O2) availability and often follows a Michaelis-Menten-like response. A multiscale model is presented to calculate gas exchange in plants using the microscale geometry of the tissue, or vice versa, local concentrations in the cells from macroscopic gas concentration profiles. This approach provides a computationally feasible and accurate analysis of cell metabolism in any plant organ during hypoxia and anoxia. The predicted O2 and carbon dioxide (CO2) partial pressure profiles compared very well with experimental data, thereby validating the multiscale model. The important microscale geometrical features are the shape, size, and three-dimensional connectivity of cells and air spaces. It was demonstrated that the gas-exchange properties of the cell wall and cell membrane have little effect on the cellular gas exchange of apple (Malus×domestica) parenchyma tissue. The analysis clearly confirmed that cells are an additional route for CO2 transport, while for O2 the intercellular spaces are the main diffusion route. The simulation results also showed that the local gas concentration gradients were steeper in the cells than in the surrounding air spaces. Therefore, to analyze the cellular metabolism under hypoxic and anoxic conditions, the microscale model is required to calculate the correct intracellular concentrations. Understanding the O2 response of plants and plant organs thus not only requires knowledge of external conditions, dimensions, gas-exchange properties of the tissues, and cellular respiration kinetics but also of microstructure.


Figures

Figure 1.
Figure 1.
Schematic of the multiscale paradigm. A, Homogenization involves calculating apparent material properties of the model at some scale i from simulations with the model that operates at the lower scale i 2 1. B, In localization, special regions of interest (ROI) are identified at some scale of interest i; more detailed simulations are then carried out in these regions of interest using the model that operates at scale i 2 1 [See online article for color version of this figure.]
Figure 2.
Figure 2.
X-ray computed tomography images of an intact apple (A) and a cubical apple cortex tissue sample (B).
Figure 3.
Figure 3.
Simulated O2 and CO2 concentrations in a typical sample of cortex tissue of apple Jonagold. At the left of the computational domain, the O2 and CO2 partial pressures were set to 9 kPa; at the right side, the O2 and CO2 partial pressures were set to 11 and 7 kPa, respectively, to ensure a partial pressure difference of 2 kPa for both gases. The lateral sides of the sample were assumed to be impermeable. A and C, O2 and CO2 concentrations in the intercellular space. B and D, O2 and CO2 concentrations in the cell. The color bar indicates the gas concentration (mol m−3).
Figure 4.
Figure 4.
A and B, O2 and CO2 partial pressure distribution in a vertical slice along the vertical axis of the fruit stored at 20 kPa O2, 0 kPa CO2, and 20°C. The macroscale model was used for the computation. Color bars indicate the gas partial pressure (kPa). C, O2 and CO2 concentrations as a function of time in a closed jar containing a Jonagold apple. The dashed lines and solid line indicate the computed O2 and CO2 partial pressures in the jar, respectively; crosses and circles indicate the measured O2 and CO2 gas partial pressures for initial conditions equal to 20 kPa O2, 0 kPa CO2, and 10°C. The dashed-dotted lines and plus symbols indicate the simulated and measured CO2 gas partial pressures in the jar, respectively, for initial conditions equal to 0 kPa O2, 0 kPa CO2, and10°C. For both sets of initial conditions, three experiments with different fruit were carried out and simulated. D, Radial O2 partial pressure profile in cortex tissue from the center to the boundary of the fruit (r = 38.6 mm). The O2 and CO2 concentrations of the external atmosphere were equal to 20 and 0 kPa CO2, respectively, and the temperature was 20°C.
Figure 5.
Figure 5.
Normalized O2 consumption (RO2/Vm,O2) of intact apple fruit as a function of the ambient O2 partial pressure at 1°C (A) and 10°C (B). Solid lines represent computed results from the multiscale model, while circles indicate the measurements. The dashed line in B represents the modeled Michaelis-Menten kinetics of O2 consumption of the intact apple at 10°C with Km,O2 = 3.76 kPa (Hertog et al., 1998).
Figure 6.
Figure 6.
Simulated intracellular O2 and CO2 concentration distributions in cortex tissue of a Jonagold apple near the core. The left side of the sample was assumed to be at the center of the apple and impermeable. At the right side, the partial pressure computed using the macroscale model at the corresponding position was applied (6.7219 kPa O2 and 8.392 kPa CO2). The other sides of the sample were assumed to be impermeable. The color bars indicate the gas concentrations (mol m−3). A and B, O2 and CO2 concentrations inside the cells, respectively. C, Simulated macroscopic O2 concentration. D, Cross section showing the O2 concentration inside the cell with an indication of the critical point Pc (minimal O2 and maximal CO2 in the tissue).

References

    1. Aalto T, Juurola E. (2002) A three-dimensional model of CO2 transport in airspaces and mesophyll cells of a silver birch leaf. Plant Cell Environ 25: 1399–1409
    1. Armstrong W, Webb T, Darwent M, Beckett PM. (2009) Measuring and interpreting respiratory critical oxygen pressures in roots. Ann Bot (Lond) 103: 281–293 - PMC - PubMed
    1. Bidel LPR, Renault P, Pagès L, Rivière LM. (2000) Mapping meristem respiration of Prunus persica (L.) Batsch seedlings: potential respiration of the meristems, O2 diffusional constraints and combined effects on root growth. J Exp Bot 51: 755–768 - PubMed
    1. Borisjuk L, Rolletschek H. (2009) The oxygen status of the developing seed. New Phytol 182: 17–30 - PubMed
    1. Colmer TD, Voesenek LACJ. (2009) Flooding tolerance: suites of plant traits in variable environments. Funct Plant Biol 36: 665–681 - PubMed

Publication types

LinkOut - more resources