. 2011 Feb 1;124(Pt 3):369-83.
doi: 10.1242/jcs.071985. Epub 2011 Jan 11.

Integrin α5β1 facilitates cancer cell invasion through enhanced contractile forces

Affiliations

Integrin α5β1 facilitates cancer cell invasion through enhanced contractile forces

Claudia Tanja Mierke et al. J Cell Sci. .

Abstract

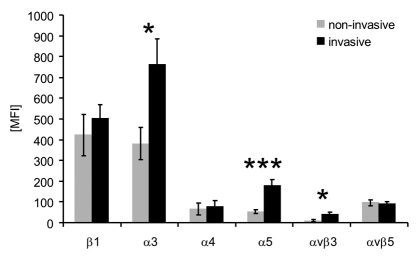
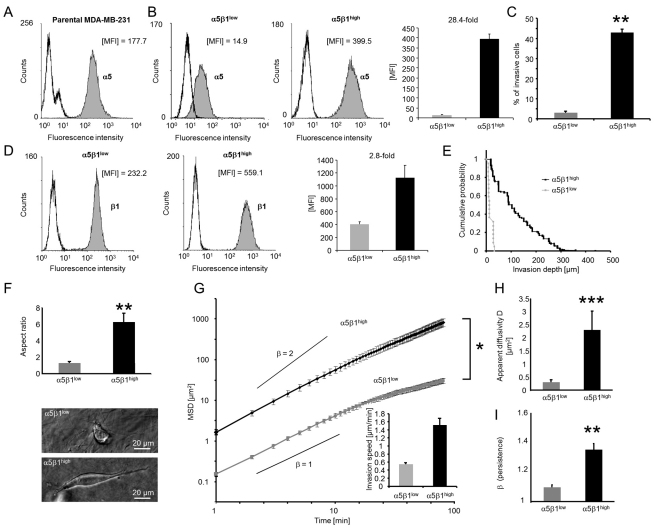
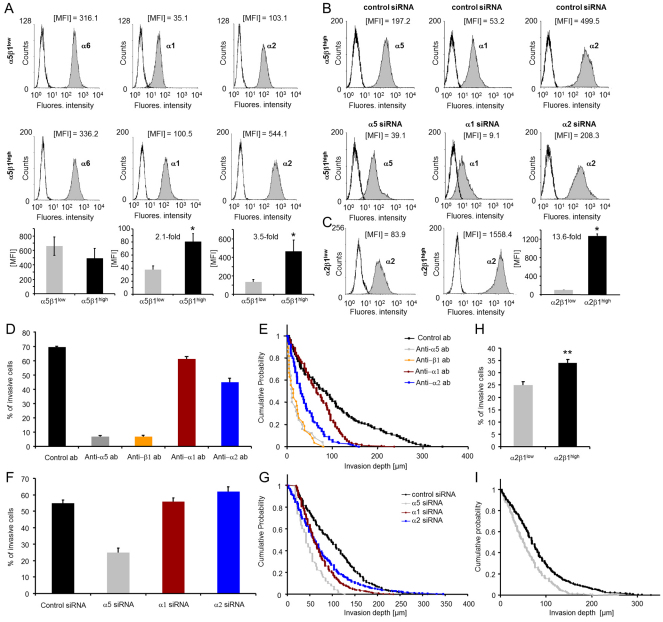
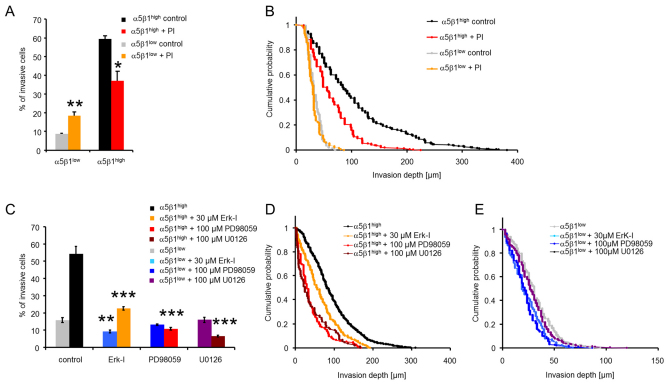
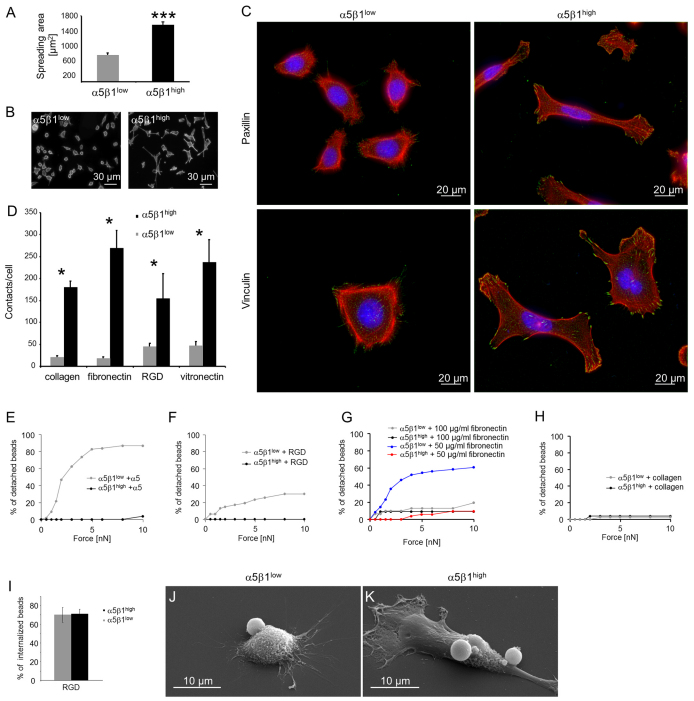
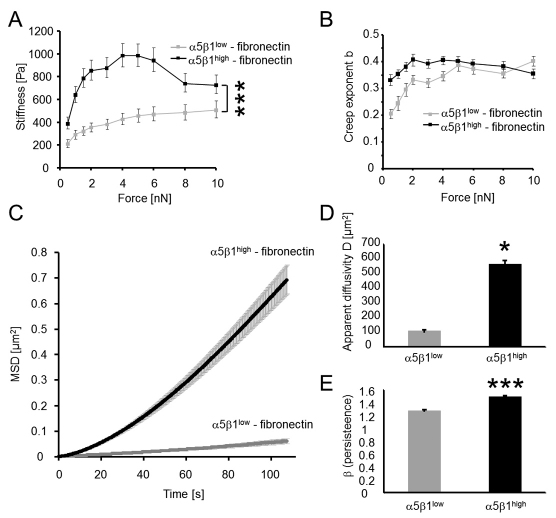
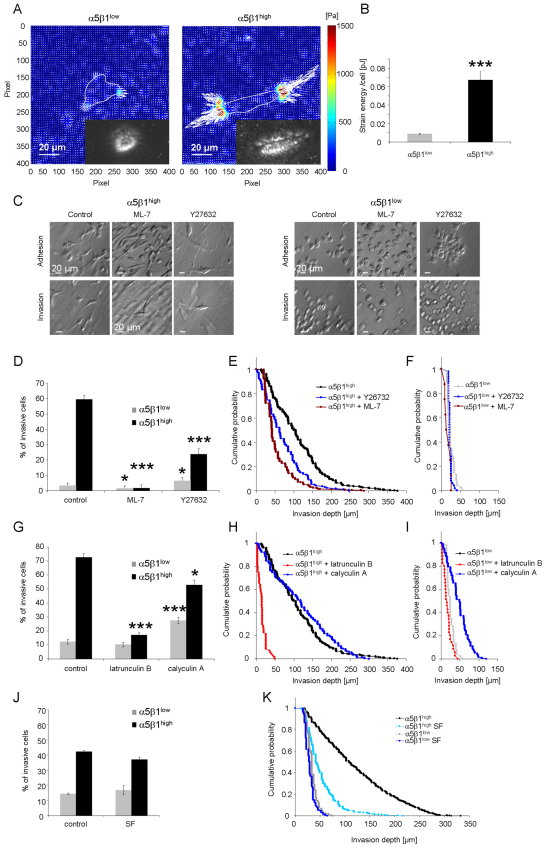
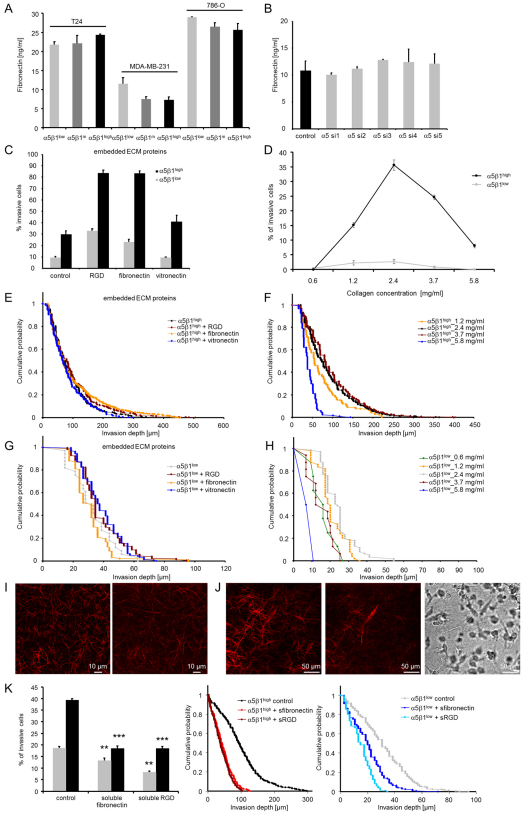
Cell migration through connective tissue, or cell invasion, is a fundamental biomechanical process during metastasis formation. Cell invasion usually requires cell adhesion to the extracellular matrix through integrins. In some tumors, increased integrin expression is associated with increased malignancy and metastasis formation. Here, we have studied the invasion of cancer cells with different α5β1 integrin expression levels into loose and dense 3D collagen fiber matrices. Using a cell sorter, we isolated from parental MDA-MB-231 breast cancer cells two subcell lines expressing either high or low amounts of α5β1 integrins (α5β1(high) or α5β1(low) cells, respectively). α5β1(high) cells showed threefold increased cell invasiveness compared to α5β1(low) cells. Similar results were obtained for 786-O kidney and T24 bladder carcinoma cells, and cells in which the α5 integrin subunit was knocked down using specific siRNA. Knockdown of the collagen receptor integrin subunit α2 also reduced invasiveness, but to a lesser degree than knockdown of integrin subunit α5. Fourier transform traction microscopy revealed that the α5β1(high) cells generated sevenfold greater contractile forces than α5β1(low) cells. Cell invasiveness was reduced after addition of the myosin light chain kinase inhibitor ML-7 in α5β1(high) cells, but not in α5β1(low) cells, suggesting that α5β1 integrins enhance cell invasion through enhanced transmission and generation of contractile forces.


Figures

Fig. 1.
Fig. 1.
Invasion assay. (A) Schematic of the cancer cell invasion assay. (B–D) SEM images of MDA-MB-231 breast cancer cells show that the cells adhered on (C) or invaded in 3D collagen matrices (D). (E–G) TEM images show that invasive MDA-MB-231 cells formed filopodia inside 3D collagen matrices. (E) Overview image. (F,G) Magnifications of boxed areas in E. (H,I) Cancer cells that invaded into 3D collagen matrices show a dense cytoskeletal network. (I) Magnification of boxed area in H. Arrows point to the dense cytoskeletal network inside an invasive MDA-MB-231 cell.
Fig. 2.
Fig. 2.
Integrin expression of invasive and non-invasive cancer cells correlate with invasion. Expression of various integrins was measured in invasive (n=24), and non-invasive cancer cell lines (n=27). Invasive cells expressed twofold higher levels of integrin α3, threefold higher levels of α5 and fourfold higher levels of αvβ3. Data are presented as mean ± s.e.m. *P<0.05, ***P<0.001. MFI, mean fluorescence intensities.
Fig. 3.
Fig. 3.
Effect of α5β1 integrin expression on cell invasion in 3D ECMs. (A) α5 integrin subunit expression of parental MDA-MB-231 cells. (B) α5 and (D) β1 integrin subunit expression of α5β1low and α5β1high cells. In each histogram, left curves are isotype controls and filled gray curves show integrin expression. One representative experiment out of five is shown. The corresponding bar graphs show MFI values (mean + s.e.m., n=5). (C) A higher percentage of α5β1high cells invaded into 3D ECMs compared to α5β1low cells after 3 days. (E) Invasion profiles show that α5β1high cells migrated deeper into 3D collagen matrices than did α5β1low cells. (F) Aspect ratio of invaded α5β1high and α5β1low cells after 3 days. Bright field images of α5β1high (lower image, depth 180 μm) and α5β1low cells (upper image, depth 68 μm) inside collagen gels. (G) The MSD of α5β1high cells was significantly greater than that of α5β1low cells. Inset: invasion speed of α5β1high and α5β1low cells in 3D ECMs. Calculated slopes for the power-law exponent β=1 and β=2 are shown. (H) The apparent diffusivity was increased in α5β1high cells, indicating a higher migration speed. (I) The 3D motility of α5β1high cells was more persistent than that of α5β1low cells, as shown by a higher β. *P<0.05, **P<0.01, ***P<0.001.
Fig. 4.
Fig. 4.
Integrin expression of subcell lines and inhibition of α5β1-integrin-mediated cell invasion. (A) Analysis by flow cytometry of both subclones revealed different α1, α2 and α6 integrin expression. One representative experiment out of six is shown. The corresponding bar graphs show MFI values (mean + s.e.m., n=6). (B) Flow cytometry analysis of integrin expression on α5β1high cells after addition of unspecific control siRNA (top row) or specific siRNAs (bottom row) targeting integrins α5 (left), α1(middle) and α2 (right). One representative experiment out of at least three is shown. (C) Analysis by flow cytometry of α2β1low and α2β1high subclones. One representative experiment out of at least five is shown. The bar graphs show MFI values (mean + s.e.m., n=5). (D) Percentage of invasive cells and (E) invasion profiles of α5β1high cells after addition of 100 μM of control antibodies (black) or blocking antibodies against integrins α5 (gray), β1 (orange), α1 (red) and α2 (blue). (F) Percentage of invasive cells and (G) invasion profiles of α5β1high cells transfected with control siRNA (black) or with siRNAs targeting integrins α5 (gray), α1 (red) and α2 (blue). (H) Percentage of invasive cells and (I) invasion profiles of α2β1low and α2β1high subclones. *P<0.05, **P<0.01.
Fig. 5.
Fig. 5.
Effect of enzymatic ECM degradation and ERK1/2 inhibition on cell invasion. (A) Percentage of invasive α5β1high cells (red) was reduced after addition of a protease inhibitor cocktail (PI), whereas the number of invasive cells was increased in α5β1low cells (orange). (B) The invasion profile shows that the PI-treated α5β1high cells did not invade as deep as control cells (DMSO-treated), whereas the invasion profile was not altered in PI-treated α5β1low cells. (C–E) The percentage of invasive α5β1high cells (C) and their invasion depths (D) were decreased after addition of the inhibitors 328005 (30 μM; Erk-1), PD98059 (100 μM) or U0126 (100 μM), whereas the percentage of invasive α5β1low cells (C) was slightly reduced and their invasion depths (E) were only marginally altered. *P<0.05, **P<0.01, ***P<0.001.
Fig. 6.
Fig. 6.
Adhesion of α5β1high and α5β1low cells. (A) Spreading area of α5β1high and α5β1low cells after 24 hours of adhesion to collagen-coated glass substrates. (B) Representative fluorescence images of α5β1high (right) and α5β1low (left) cells stained for actin with Alexa-Fluor-546-conjugated phalloidin. These images were used to determine the spreading area. (C) Fluorescence images of α5β1high (right) and α5β1low (left) cells stained for actin with Alexa-Fluor-546-conjugated phalloidin (red) and Hoechst 33342 for DNA (blue). Focal adhesions were stained with antibodies against vinculin (bottom) or paxillin (top) (green). (D) The number of adhesion contacts per cell (vinculin stained) was significantly increased in α5β1high as compared with α5β1low cells after 24 hours of adhesion on ECM proteins. (E,F) Increased bond stability (bead detachment) of integrin α5β1high cells towards anti-α5-antibody-coated (10 μg/ml antibody) beads (E) and 100 μg/ml RGD-peptide-coated beads (F) compared to α5β1low cells. (G,H) Bond stability of both subcell lines towards beads coated with100 μg/ml or 50 μg/ml fibronectin (G) and 100 μg/ml collagen (H). (I) Percentages of internalized RGD-peptide-coated beads after 30 minutes of incubation with α5β1high and α5β1low cells. (J,K) Representative SEM images of α5β1low (J) and α5β1high (K) cells that bound or internalized RGD peptide beads. *P<0.05, ***P<0.001.
Fig. 7.
Fig. 7.
Mechanical properties of α5β1high and α5β1low cells. (A) Stiffness of α5β1high and α5β1low cells measured during increasing force application to fibronectin-coated beads. (B) Power-law exponent b (cell fluidity) of α5β1high and α5β1low cells versus force applied to fibronectin-coated beads. The values are expressed as mean ± s.e.m. (C–E) MSD of spontaneous bead motion (C) showed a higher apparent diffusivity (D) and a higher persistence (power-law exponent β) (E) in α5β1high cells than in α5β1low cells. *P<0.05, ***P<0.001.
Fig. 8.
Fig. 8.
Increased contractile force generation of α5β1high cells and inhibition of contractile-force-mediated cell invasion. (A) Representative traction fields of a α5β1low cell (left) and α5β1high cell (right). The gray line represents the cell boundaries. The insets show a bright field image of the measured cells. (B) The strain energy per cell (mean + s.e.m.) of α5β1high cells (n=80) was increased sevenfold compared to α5β1low cells (n=84). (C) Modulation contrast images of adherent cells on top of collagen gels (top row) or after 3 days of gel invasion (bottom row) show no morphology changes after treatment with myosin contraction inhibitors ML-7 or Y27632. (D) Percentage (mean + s.e.m.) of invasive α5β1high cells or α5β1low cells determined after 3 days in the presence of 100 μM Y27632, 15 μM ML-7 or DMSO as control. (E,F) Invasion profiles of α5β1high (E) and α5β1low (F) cells treated with Y26732, ML-7 or DMSO as control. (G) Percentage of invasive cells (mean ± s.e.m.) of α5β1high or α5β1low cells was determined after 3 days in the presence of actin polymerization inhibitor (2 μM latrunculin B), myosin phosphatase inhibitor (1 nM calyculin A) or DMSO as control. (H,I) Invasion profiles of α5β1high (H) and α5β1low (I) cells treated with latrunculin B, calyculin A or DMSO as control. (J) The use of serum-free medium (SF) did not alter the percentage of invasive cells. (K) Serum-free conditions reduced the invasion depths of invasive α5β1high cells but not α5β1low cells. *P<0.05, ***P<0.001. Scale bars: 20 μm.
Fig. 9.
Fig. 9.
Effect of ECM proteins and collagen density on α5β1-integrin-facilitated cell invasion. (A) Concentration of fibronectin in the medium secreted by T24, MDA-MB-231 and 786-O cancer cells with low, medium and high α5β1 integrin expression after 3 days of invasion into 3D collagen matrices. (B) Concentration of secreted fibronectin in the medium after 3 days of siRNA-mediated knockdown of α5 integrin. Unspecific siRNA served as control and five different siRNAs were used for specific α5 knockdown (α5 si1–si5). (C) The percentage of invasive cells strongly increased in 3D matrices containing 100 μg/ml fibronectin (embedded) or RGD peptide (embedded), and slightly increased in 3D matrices containing 100 μg/ml vitronectin (embedded). (D) Five different collagen concentrations of 0.6, 1.2, 2.4, 3.7, and 5.8 mg/ml were tested for cell invasion. After 3 days, α5β1high cells were able to invade into 1.2–5.8 mg/ml collagen gels, whereas α5β1low cells were able to migrate into 0.6–3.7 mg/ml collagen gels. (EH) The invasion profiles of α5β1high (E) and α5β1low (G) cells were not altered by the addition of fibronectin, RGD peptide or vitronectin. Invasion profiles of α5β1high (F) and α5β1low (H) cells in 3D ECMs with increasing collagen concentrations, as indicated. (I) Confocal images of 3D fibronectin–collagen matrices. Left: reflection mode shows the collagen fibers. Right: fluorescent image of an anti-fibronectin staining of the same matrix. (J) Confocal images of a 3D collagen matrix with an invasive α5β1high cell. Left: reflection mode shows the matrix fibers and the cell. Middle: fibronectin staining of the same matrix and the cell. Right: bright field image of the same field of view. (K) Left: the percentage of invasive α5β1high and α5β1low cells strongly decreased in 3D matrices containing 100 μg/ml soluble fibronectin or 100 μg/ml soluble RGD peptide. The invasion profiles of α5β1high (middle) and α5β1low cells (right) show reduced invasiveness after addition of soluble (s) fibronectin and RGD peptide. The bar graphs show means + s.e.m. **P<0.01, ***P<0.001.

References

    1. Al-Mehdi A. B., Tozawa K., Fisher A. B., Shientag L., Lee A., Muschel R. J. (2000). Intravascular origin of metastasis from the proliferation of endothelium-attached tumor cells: a new model for metastasis. Nat. Med. 6, 100-102 - PubMed
    1. Balaban N. Q., Schwarz U. S., Riveline D., Goichberg P., Tzur G., Sabanay I., Mahalu D., Safran S., Bershadsky A., Addadi L., et al. (2001). Force and focal adhesion assembly: a close relationship studied using elastic micropatterned substrates. Nat. Cell Biol. 3, 466-472 - PubMed
    1. Batlle E., Sancho E., Franci C., Dominguez D., Monfar M., Baulida J., Garcia De Herreros A. (2000). The transcription factor snail is a repressor of E-cadherin gene expression in epithelial tumour cells. Nat. Cell Biol. 2, 84-89 - PubMed
    1. Bauer K., Mierke C., Behrens J. (2007). Expression profiling reveals genes associated with transendothelial migration of tumor cells: a functional role for alpha v beta3 integrin. Int. J. Cancer 121, 1910-1918 - PubMed
    1. Behrens J., Mareel M. M., Van Roy F. M., Birchmeier W. (1989). Dissecting tumor cell invasion: epithelial cells acquire invasive properties after the loss of uvomorulin-mediated cell-cell adhesion. J. Cell Biol. 108, 2435-2447 - PMC - PubMed

Publication types

MeSH terms