. 2011 Feb 1;108(5):1799-803.
doi: 10.1073/pnas.1018154108. Epub 2011 Jan 11.

Scaling rules for diffusive drug delivery in tumor and normal tissues

Affiliations

Scaling rules for diffusive drug delivery in tumor and normal tissues

James W Baish et al. Proc Natl Acad Sci U S A. .

Abstract

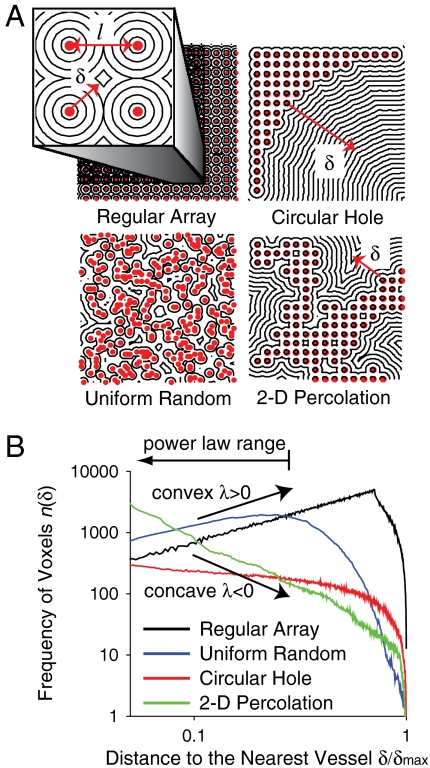
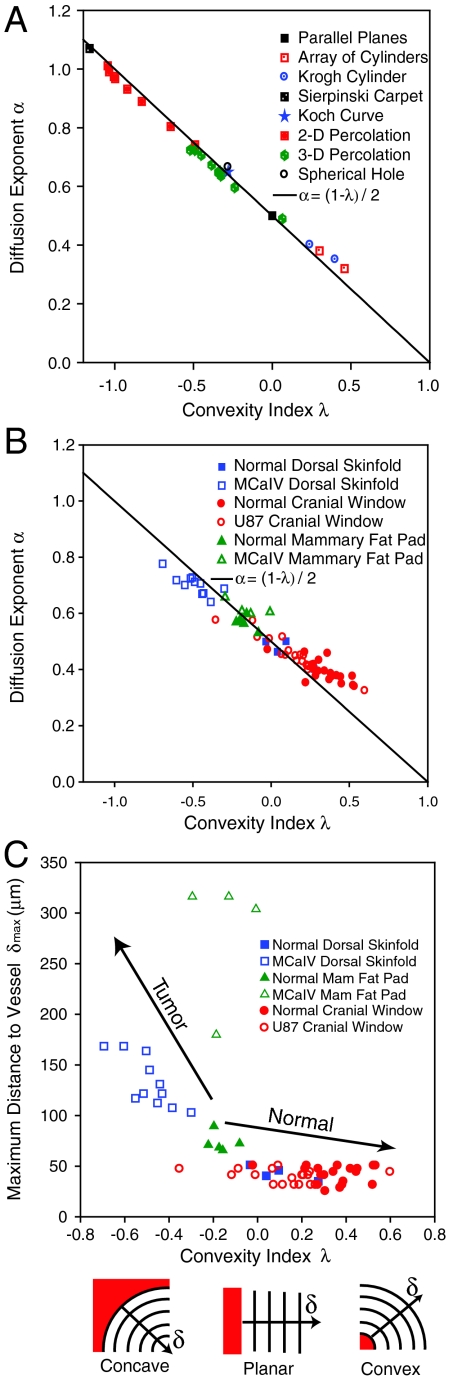
Delivery of blood-borne molecules and nanoparticles from the vasculature to cells in the tissue differs dramatically between tumor and normal tissues due to differences in their vascular architectures. Here we show that two simple measures of vascular geometry--δ(max) and λ--readily obtained from vascular images, capture these differences and link vascular structure to delivery in both tissue types. The longest time needed to bring materials to their destination scales with the square of δ(max), the maximum distance in the tissue from the nearest blood vessel, whereas λ, a measure of the shape of the spaces between vessels, determines the rate of delivery for shorter times. Our results are useful for evaluating how new therapeutic agents that inhibit or stimulate vascular growth alter the functional efficiency of the vasculature and more broadly for analysis of diffusion in irregularly shaped domains.


Conflict of interest statement

Conflict of interest statement: R.K.J. received commercial research grants from Dyax, AstraZeneca, and MedImmune; consultant fees from AstraZeneca/MedImmune, Dyax, Astellas-Fibrogen, Regeneron, Genzyme, Morphosys, and Noxxon Pharma; and a speaker honorarium from Genzyme. R.K.J. owns stock in SynDevRx. No reagents or funding from these companies was used in these studies. There is no significant financial or other competing interest in the work.

Figures

Fig. 1.
Fig. 1.
Vasculature in normal subcutaneous and tumor tissues. (A) Normal capillaries appear as fine, nearly parallel vessels that are served by orderly, branching arterial, and venous trees (26) (Scale bar = 100 μm). (B) A mammary carcinoma (MCaIV) was grown in mammary fat pad of a mouse using a procedure described in (27) and imaged with Doppler optical frequency domain imaging (28) (Scale bar = 1 mm). Growth factors secreted by the tumor promote dilation and tortuosity of the capillaries (a) outside the tumor margin (dashed line). In contrast, the tumor vessels are highly disorganized (b), leaving large, irregular avascular spaces (c).
Fig. 2.
Fig. 2.
Tracer clearance from vascular networks. Venous output concentrations were measured following a brief arterial injection into breast tumor that was grown in a rat with a single arterial supply and venous return by a procedure described in Eskey et al. (8). Output concentrations are shown for two blood-borne agents—one intravascularly restricted due to its large molecular weight (IVT), the other free to diffuse from the vasculature to the adjacent tissue (D2O). Due to the short duration of the input, at long-times the output concentration approximates the residence time from a perfect pulse h(t). A typical trial is shown in which the tails of the outputs are fit to power laws: hD2O(t) ∼ t-1.67 and hIVT(t) ∼ t-2.36. Averaging 2 trials on each of 4 tumors we find hD2O(t) ∼ t-1.73±0.09 and hIVT(t) ∼ t-2.29±0.20 with a tumor mass of formula image 
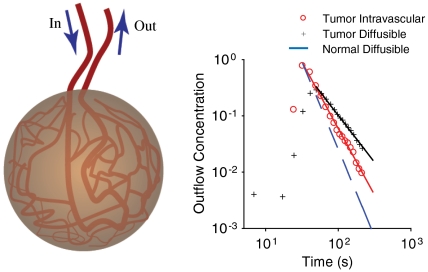
(mean ± SEM). For comparison, published results (9) for a highly diffusible tracer (O15) in normal myocardium yielded a narrower range of transit times (hO15(t) ∼ t-3.1).
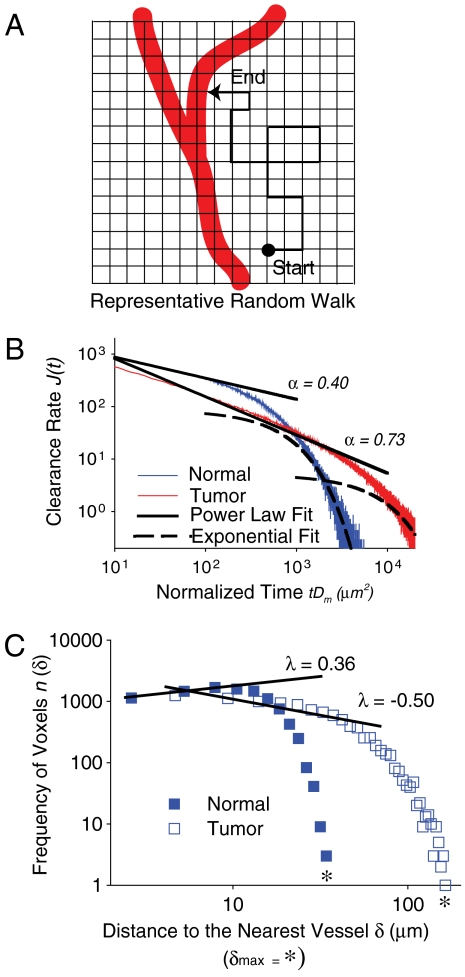
Fig. 3.
Fig. 3.
Diffusion in the extravascular tissue of normal and tumor tissue. 3-D images of the transparent window (600 × 600 × 150 voxels) similar to those in Fig. 1 were obtained using Doppler optical frequency domain imaging for normal capillaries and a mammary carcinoma MCaIV (SI Materials and Methods). (A) Extravascular diffusion was simulated by random walks of 106 walkers, released at random voxels in the extravascular space. At each time step, the walkers were allowed to move at random to an adjacent voxel. (B) The rate at which walkers are absorbed at the vessels wall is J(t). Power-law behavior J(t) ∼ t-α appears as a straight line on the log(t) vs log(J(t)) axes. This situation corresponds to clearance following a step change in the intravascular concentration where the mass transfer rate is proportional to the rate at which walkers are absorbed by the vessels. The number of time steps N is related to physical time by t = Nl2/2DmD (29) where l is the voxel size (l ≅ 4.7 μm for normal capillaries), Dm is the diffusivity of the tracer and D = 3 is the dimension of the space. We note that these clearance rates from a uniform initial condition are related to the pulse clearance experiments shown in Fig. 2 by h(t) = -dJ(t)/dt ∼ t-α-1 in the power-law range.
Fig. 4.
Fig. 4.
Interpretation of the convexity index. (A) Various arrangements of vessels shown in 2D with contours of δ, distance to the nearest vessel. The mean spacing between adjacent vessels is defined as l. (B) Histograms of the number of voxels present at a given distance from the nearest vessel for the arrangements shown in panel A.
Fig. 5.
Fig. 5.
Geometrical and diffusion parameters in normal and tumor tissues. The convexity indices and the diffusion exponents are calculated from artificial structures (A) and from 3D images of several tissue types (B). Values of λ are based on the slope of log(δ) vs. log(n(δ)) over the range δ < δmax/3, whereas α is obtained from the corresponding interval time on the clearance curves t = δ2/Dm. The equation α = (1 - λ)/2 is shown to closely predict the relationship in all cases. Panel C shows a parametric map for various tissue types of the geometrical measures, δmax and λ, that govern extravascular diffusion. The icons below the convexity axis indicate simple examples of concave, planar, and convex geometries. The array of cylinders represents a regular array of cylindrical vessels on square centers—shown for two ratios of vessel radius to vessel spacing. The classical Krogh cylinder geometry (3) is also shown for two ratios of the vessel diameter to radius of the surrounding tissue cylinder. Ten realizations are shown for 2D (200 × 200) and 3D (64 × 64 × 64) percolation clusters at the critical threshold. Results for 6-generation realizations of the Koch curve and Sierpinski carpet are shown. Numerical methods in SI Discussion, Numerical Simulations for Specific Geometries. MCaIV is a mammary carcinoma. U87 is a human glioma.

References

    1. Endrich B, Reinhold HS, Gross JF, Intaglietta M. Tissue perfusion inhomogeneity during early tumor growth in rats. J Natl Cancer Inst. 1979;62:387–395. - PubMed
    1. Jain RK. Normalization of tumor vasculature: An emerging concept in antiangiogenic therapy. Science. 2005;307:58–62. - PubMed
    1. Krogh A. The number and distribution of capillaries in muscles with calculations of the oxygen pressure head necessary for supplying the tissue. J Physiol. 1919;52:409–415. - PMC - PubMed
    1. West GB, Brown JH, Enquist BJ. A general model for the origin of allometric scaling laws in biology. Science. 1997;276:122–126. - PubMed
    1. West GB, Brown JH, Enquist BJ. The fourth dimension of life: Fractal geometry and allometric scaling of organisms. Science. 1999;284:1677–1679. - PubMed

Publication types

Substances