. 2011 Jan 11:2:154.
doi: 10.1038/ncomms1155.

Neural stem and progenitor cells shorten S-phase on commitment to neuron production

Affiliations
Free PMC article

Neural stem and progenitor cells shorten S-phase on commitment to neuron production

Yoko Arai et al. Nat Commun. .
Free PMC article

Abstract

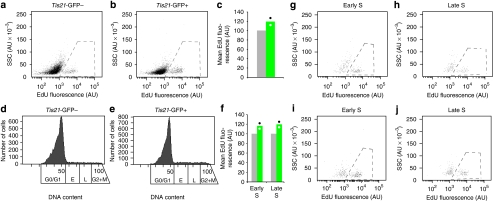
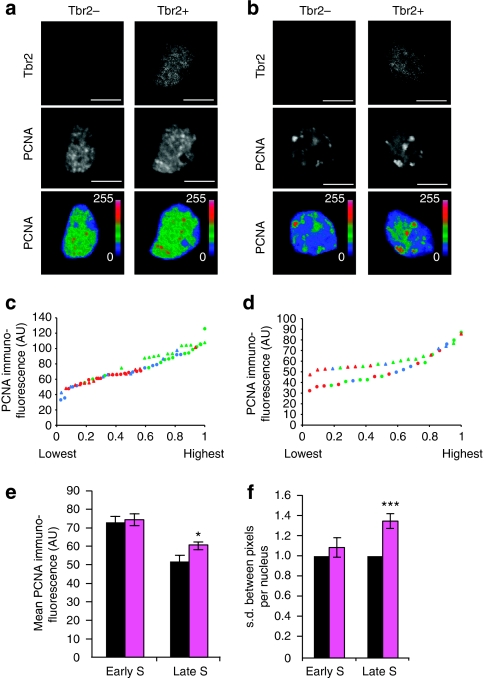
During mammalian cerebral cortex development, the G1-phase of the cell cycle is known to lengthen, but it has been unclear which neural stem and progenitor cells are affected. In this paper, we develop a novel approach to determine cell-cycle parameters in specific classes of neural stem and progenitor cells, identified by molecular markers rather than location. We found that G1 lengthening was associated with the transition from stem cell-like apical progenitors to fate-restricted basal (intermediate) progenitors. Unexpectedly, expanding apical and basal progenitors exhibit a substantially longer S-phase than apical and basal progenitors committed to neuron production. Comparative genome-wide gene expression analysis of expanding versus committed progenitor cells revealed changes in key factors of cell-cycle regulation, DNA replication and repair and chromatin remodelling. Our findings suggest that expanding neural stem and progenitor cells invest more time during S-phase into quality control of replicated DNA than those committed to neuron production.


Figures

Figure 1
Figure 1. Classification of proliferative and neurogenic APs and BPs on the basis of differential marker expression.
(a) Pax6 (red), Tbr2 (blue), Tis21-GFP (green) and DAPI (white) staining. Red arrowheads, Pax6+/Tbr2−/Tis21-GFP− nuclei (APs); yellow arrowheads, Pax6+/Tbr2+/Tis21-GFP+ nuclei (BPs); blue arrowheads, Pax6−/Tbr2+/Tis21-GFP+ nucleus (BP). Scale bar, 50 μm. (b) Quantification of Tbr2+/Pax6+ (blue–red) and Tbr2−/Pax6+ (red) nuclei in VZ, SVZ and VZ+SVZ, each expressed as a percentage of total Pax6+ nuclei. (c) Quantification of the percentage of Tis21-GFP+ (green) and Tis21-GFP− (white) Tbr2−/Pax6+ nuclei in VZ+SVZ. (d, e) Pax6 (red), Tbr1 (d) or Tuj1 (e) (green) and DAPI (white) staining. Scale bar, 50 μm. (f) Tbr2 (red), Tbr1 (blue), Tis21-GFP (green) and DAPI (white) staining. Red arrowheads, Tbr2+/Tbr1−/Tis21-GFP+ nucleus (BP); yellow arrowheads, Tbr2+/Tbr1+/Tis21-GFP+ nucleus (neuron); blue arrowheads, Tbr2−/Tbr1+/Tis21-GFP+ nucleus (neuron). Scale bar, 50 μm. (g) Quantification of Tbr1+/Tbr2+ (blue–red) and Tbr1−/Tbr2+ (red) nuclei in VZ, SVZ and VZ+SVZ, each expressed as a percentage of total Tbr2+ nuclei. (h) Quantification of the percentage of Tis21-GFP+ (green) and Tis21-GFP− (white) Tbr1−/Tbr2+ nuclei in VZ+SVZ. (a, d, e, f) White lines at margins, VZ and SVZ boundaries. (b, c, g, h) Data are the mean of three 225-μm-wide fields, each from a different brain and litter; error bars indicate s.e.m. Images in (a, d, f) and data in (b, c, g, h) are from embryos subjected to cumulative EdU labelling for 5 h (a, d), 1 h (f) and 5, 9 and 12 h (b, c, g, h; compare Supplementary Fig. S4).
Figure 2
Figure 2. Cumulative EdU labelling of proliferative and neurogenic APs and BPs.
(a, b) Pax6 (magenta), Tbr2 (blue), Tis21-GFP (green) and EdU (white) staining after cumulative EdU labelling for 9 h. Individual AP nuclei indicated by arrows/arrowheads in (a) are shown at higher magnification in (b) (asterisks); white arrowheads, Pax6+/Tbr2−/Tis21-GFP−/EdU− nucleus; white arrows, Pax6+/Tbr2−/Tis21-GFP−/EdU+ nucleus; yellow arrowheads, Pax6+/Tbr2−/Tis21-GFP+/EdU− nucleus; yellow arrows, Pax6+/Tbr2−/Tis21-GFP+/EdU+ nucleus. VZ and SVZ are indicated on the left. Scale bars, 50 μm (a) and 10 μm (b). (c, d) Tbr2 (magenta), Tbr1 (blue), Tis21-GFP (green) and EdU (white) staining after cumulative EdU labelling for 9 h. Individual BP nuclei indicated by arrows/arrowheads in (c) are shown at higher magnification in (d) (asterisks); white arrowheads, Tbr2+/Tbr1−/Tis21-GFP−/EdU− nucleus; white arrows, Tbr2+/Tbr1−/Tis21-GFP−/EdU+ nucleus; yellow arrowheads, Tbr2+/Tbr1−/Tis21-GFP+/EdU− nucleus; yellow arrows, Tbr2+/Tbr1−/Tis21-GFP+/EdU+ nucleus. VZ and SVZ are indicated on the left. Scale bars, 50 μm (c) and 10 μm (d). (e, f) Proportion of EdU-labelled NPC nuclei (EdU labelling index) after cumulative EdU labelling for 0.5, 1, 2, 3, 5, 9, 12, 18, 24 and 29 h. The EdU labelling index was separately determined for the various AP (Pax6/Tbr2/GFP/EdU staining as in (a)) and BP (Tbr2/Tbr1/GFP/EdU staining as in (c)) populations, as follows: total APs (e, Tbr2−/Pax6+, blue circles), total BPs (e, Tbr1−/Tbr2+, red squares), proliferative APs (f, Tbr2−/Pax6+/Tis21-GFP−, blue diamonds), BP-genic/neurogenic APs (f, Tbr2−/Pax6+/Tis21-GFP+, purple squares), proliferative BPs (f, Tbr1−/Tbr2+/Tis21-GFP−, red triangles) and neurogenic BPs (f, Tbr1−/Tbr2+/Tis21-GFP+, green crosses). Data are the mean of three 225-μm-wide fields (except for the 1-, 9- and 29-h time points, which are from five, two and one field(s), respectively), each from a different brain and litter; error bars indicate s.e.m. or the range of the two individual values. Dashed lines and colour-coded arrowheads indicate the growth fraction; colour-coded arrows indicate the time point at which the labelling index reaches a plateau (TCTS).
Figure 3
Figure 3. Identification of S-phase NPC nuclei by PCNA immunostaining.
(a, b, c, d) Pax6 (magenta) or Tbr2 (magenta), PCNA (blue) and DAPI staining (c, d, white). Individual nuclei indicated by arrowheads in (a) and (b) are shown at higher magnification in (c) and (d), respectively; white arrowheads, S-phase nuclei showing punctate PCNA immunoreactivity; yellow arrowheads, G1- or G2-phase nuclei showing homogeneous PCNA immunoreactivity. All Pax6+ nuclei (a) and all Tbr2+ nuclei (b) that show punctate PCNA immunoreactivity are indicated by white dots in the respective right panel. Scale bars, 50 μm (a, b) and 10 μm (c, d). (e) Percentage of AP and BP nuclei that are in S-phase as revealed by PCNA immunostaining. Data show the percentage value of (BP) total Tbr2+ nuclei in VZ+SVZ showing punctate PCNA immunoreactivity, corrected for the contribution of neurons, and of (AP) total Pax6+ nuclei in VZ+SVZ showing punctate PCNA immunoreactivity, corrected for the contribution of BPs, and are the mean of four 225-μm-wide fields, each from a different brain and litter; error bars indicate s.d.; **P<0.01. (ae) Images in (ad) and data in (e) are from embryos subjected to cumulative EdU labelling for 5 and 3–9 h, respectively.
Figure 4
Figure 4. Time course of appearance of EdU label in proliferative and neurogenic mitotic APs and BPs.
(ad) Phosphohistone H3 (PH3, blue), Tis21-GFP (green), DAPI (white) and EdU (magenta) staining after cumulative EdU labelling for 1 h (a, c) and 3 h (b, d). Examples of cells in mitosis, as identified by positive PH3 immunostaining (PH3+) plus mitotic appearance on DAPI staining (DAPI-m), are indicated by arrowheads in (a) and (b) and are shown at higher magnification in (c) and (d), respectively; red arrowheads, DAPI-m/PH3+/Tis21-GFP−/EdU− cell (BP); green arrowheads, DAPI-m/PH3+/Tis21-GFP+/EdU− cell (BP); blue arrowheads, DAPI-m/PH3+/Tis21-GFP−/EdU− cell (AP); purple arrowheads, DAPI-m/PH3+/Tis21-GFP+/EdU− cell (AP); red arrows, DAPI-m/PH3+/Tis21-GFP−/EdU+ cell (BP); green arrows, DAPI-m/PH3+/Tis21-GFP+/EdU+ cell (BP); blue arrows, DAPI-m/PH3+/Tis21-GFP−/EdU+ cell (AP); purple arrows, DAPI-m/PH3+/Tis21-GFP+/EdU+ cell (AP). VZ and SVZ are indicated on the left. Scale bars, 50 μm (a, b) and 10 μm (c, d). (e) Proportion of EdU-labelled mitotic cells (mitotic EdU labelling index) after cumulative EdU labelling for the indicated times. The mitotic EdU labelling index was separately determined for proliferative APs (apical Tis21-GFP− mitoses, blue diamonds), BP-genic/neurogenic APs (apical Tis21-GFP+ mitoses, purple squares), proliferative BPs (basal Tis21-GFP− mitoses, red triangles) and neurogenic BPs (basal Tis21-GFP+ mitoses, green crosses). Data are the mean of three (except 2 h: where the mean is of two fields) 450-μm wide fields (sum of two 225-μm fields), each from a different brain and litter; error bars indicate s.e.m. or the range of the two individual values. (f) Diagram showing the duration of the cell-cycle phases in each NPC population (see Table 1). Blue bars, G1-phase; red bars, S-phase; yellow bars, G2-phase; green bars, M-phase.
Figure 5
Figure 5. Quantification of DNA synthesis rate by EdU incorporation in Tis21-GFP− and Tis21-GFP+ NPCs.
Following a 30-min EdU pulse labelling (two litters), cortical cells were dissociated, analysed by flow cytometry and sorted for Tis21-GFP fluorescence. Tis21-GFP− and Tis21-GFP+ cells were then separately analysed for DNA content and EdU incorporation in another round of flow cytometry, as shown in the panels. (a, b) Granularity (side scatter, SSC; AU, arbitrary units) versus EdU fluorescence of single Tis21-GFP− (a, 8,053 cells) and Tis21-GFP+ (b, 8,029 cells) cells. Dashed lines, overtly EdU-incorporating cells quantified in (c). Plots show one of the two litters analysed. (c) Mean EdU fluorescence of the overtly EdU-incorporating single Tis21-GFP− (grey column) and Tis21-GFP+ (green column) cells. For each litter, the mean EdU fluorescence of Tis21-GFP− cells was arbitrarily set to 100, and the mean EdU fluorescence of Tis21-GFP+ cells was expressed relative to this. Data are the mean of two litters, dots indicate the two individual values. (d, e) Cell number versus DNA content of the single Tis21-GFP− (d) and Tis21-GFP+ (e) cells shown in (a) and (b), respectively. Boxes indicate the sub-populations of cells in G0/G1, early S, late S and G2+M phases, as defined by DNA content; cells in early and late S-phases were analysed for SSC versus EdU fluorescence in (gj). (f) Mean EdU fluorescence of the overtly EdU-incorporating single Tis21-GFP− (grey columns) and Tis21-GFP+ (green columns) cells in early (g, i) and late (h, j) S-phase, as defined by DNA content (d, e) and after analysis of SSC versus EdU fluorescence (gj). Quantification as in (c). (gj) Granularity (SSC) versus EdU fluorescence of single Tis21-GFP− (g, h) and Tis21-GFP+ (i, j) cells in early (g, i) and late (h, j) S phase shown in (d) and (e), respectively. Dashed lines, overtly EdU-incorporating cells quantified in (f). Plots show one of the two litters analysed. AU, arbitrary units.
Figure 6
Figure 6. Quantification of PCNA immunofluorescence in Tbr2− and Tbr2+ NPCs in early versus late S-phase.
(a, b) Representative examples of PCNA immunofluorescence (white, middle panels, z-stack of five 0.95-μm optical sections from the centre of the nucleus) of Tbr2− (left panels) and Tbr2+ (right panels) NPCs. Nuclei showing relatively homogeneous PCNA immunoreactivity with a predominantly small punctate pattern were considered as early S-phase (a), nuclei showing a more heterogeneous PCNA immunoreactivity with a few strong clusters were considered as late S-phase (b). Intensity of PCNA immunofluorescence is shown in pseudocolour in the lower panels (blue, low values (0=lowest); red, high values (255=highest). Scale bars, 10 μm. (cf) Quantification of PCNA immunofluorescence of Tbr2− and Tbr2+ NPCs in early and late S-phase as defined in (a) and (b), respectively. Data are from the same cryosection per embryo and are from three embryos, each from a different litter. Numbers of nuclei analysed for embryos 1, 2, 3, were Tbr2− early S (13, 14, 10), Tbr2+ early S (13, 12, 7), Tbr2− late S (8, 9, 5), Tbr2+ late S (8, 9, 4). (c, d) Average PCNA immunofluorescence (AU, arbitrary units) of individual Tbr2− (circles) and Tbr2+ (triangles) nuclei in early (c) and late (d) S-phase, plotted in order of increasing values, with the highest Tbr2− and Tbr2+ value arbitrarily set to 1. Red, green, blue symbols indicate embryos 1, 2, 3, respectively. Data distribution of Tbr2− versus Tbr2+ nuclei in late S-phase (d), Kolmogorov–Smirnov P-value=0.002. (e) Average PCNA immunofluorescence per nucleus of Tbr2− (black) and Tbr2+ (magenta) nuclei in early (left) and late (right) S-phase. Data are the mean of the values from the three embryos shown in (c) and (d); error bars, s.d.; *P=0.028. (f) s.d. of PCNA immunofluorescence between the pixels of a given nucleus. For each embryo, the mean s.d. of Tbr2− nuclei (black) in early (left) and late (right) S-phase was arbitrarily set to 1, and the mean s.d. of Tbr2+ nuclei (magenta) was expressed relative to this. Data are the mean of the three embryos; error bars, s.d.; ***P=0.001.

References

    1. Kriegstein A. R. & Götz M. Radial glia diversity: a matter of cell fate. Glia 43, 37–43 (2003). - PubMed
    1. Götz M. & Huttner W. B. The cell biology of neurogenesis. Nat. Rev. Mol. Cell Biol. 6, 777–788 (2005). - PubMed
    1. Farkas L. M. & Huttner W. B. The cell biology of neural stem and progenitor cells and its significance for their proliferation versus differentiation during mammalian brain development. Curr. Opin. Cell Biol. 20, 707–715 (2008). - PubMed
    1. Kriegstein A. & Alvarez-Buylla A. The glial nature of embryonic and adult neural stem cells. Annu. Rev. Neurosci. 32, 149–184 (2009). - PMC - PubMed
    1. Noctor S. C., Martinez-Cerdeno V., Ivic L. & Kriegstein A. R. Cortical neurons arise in symmetric and asymmetric division zones and migrate through specific phases. Nat. Neurosci. 7, 136–144 (2004). - PubMed