Comparative Study
. 2011 Jul;14(6):721-34.
doi: 10.1017/S1461145710001616.

GABA-related transcripts in the dorsolateral prefrontal cortex in mood disorders

Affiliations
Comparative Study

GABA-related transcripts in the dorsolateral prefrontal cortex in mood disorders

Etienne Sibille et al. Int J Neuropsychopharmacol. 2011 Jul.

Abstract

Reduced cortical γ-aminobutyric acid (GABA) levels and altered markers for subpopulations of GABA interneurons have been reported in major depressive disorder (MDD) by in-vivo brain imaging and post-mortem histological studies. Subgroups of GABA interneurons exert differential inhibitory control on principal pyramidal neurons and can be identified based on the non-overlapping expression of the calcium-binding proteins parvalbumin (PV) or calretinin (CR) or the neuropeptide somatostatin (SST). As altered markers of GABAergic functions may also be present in bipolar disorder (BPD), the specificity of particular GABA-related molecular deficits in mood disorders is not known. We used real-time quantitative polymerase chain reaction (qPCR) to assess expression levels of two GABA synthesizing enzymes (glutamate decarboxylase; GAD65 and GAD67) and of three markers of GABA neuron subpopulations (PV, CR, SST) in the dorsolateral prefrontal cortex (DLPFC; Brodmann area 9) in triads (n=19) of control subjects and matched subjects with BPD or MDD. BPD subjects demonstrated significantly reduced PV mRNA, trend level reduction in SST mRNA and no alterations in GAD67, GAD65, or CR mRNA levels; MDD subjects demonstrated reduced SST mRNA expression without alterations in the other transcripts. The characteristic age-related decline in SST expression was not observed in MDD, as low expression was detected across age in MDD subjects. After controlling for age, MDD subjects demonstrated significantly reduced SST mRNA expression. Decreased SST levels in MDD were confirmed at the protein precursor level. Results were not explained by other clinical, demographic or technical parameters. In summary, MDD was characterized by low DLPFC SST, whereas decreased PV mRNA appears to distinguish BPD from MDD.


Figures

Fig. 1
Fig. 1
GABA-related transcript expression levels across three subject groups. The 2–dCt relative expression values are shown for each subject (circles). For each transcript, the mean 2–dCt relative expression values are shown for each subject group (black hash marks). The statistics (top of graph) represent the effect of diagnosis for each GABA-related transcript. Parvalbumin transcript expression was significantly reduced in subjects with bipolar disorder. effect of diagnosis for somatostatin transcript expression reached trend-level effect, which did not remain significant after correction for multiple comparisons. * Post-hoc Tukey's multiple comparison test p values. ** p values for the effect of diagnosis from one-way ANCOVAs between the subject groups indicated.
Fig. 2
Fig. 2
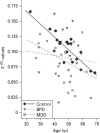
The 2–dCt relative expression values of somatostatin (SST) mRNA as a function of age. Expression levels of SST mRNA are significantly correlated with age in normal control subjects (r = –0.86, p = < 0.00001), but not in subjects with bipolar disorder (BPD) (r = –0.09, p = 0.72) or major depressive disorder (MDD) (r = –0.39, p = 0.10).
Fig. 3
Fig. 3
The effects of confounding factors in diagnostic groups with trending or significantly altered GABA-related transcripts are evaluated for parvalbumin mRNA expression in subjects with (a) bipolar disorder (BPD), (b) somatostatin (SST) mRNA expression in subjects with BPD, and (c) SST mRNA expression in subjects with MDD. Mean (hash mark) and individual (circle) 2–dCt relative expression values are grouped by potential confounding factors. Note the varying scales for the y axis between (a) and (b) or (c). Numbers below circles indicate the number of subjects in each diagnostic group for each category. AD, Antidepressant; ATOD, at time of death; SA, substance abuse; SD, substance dependence.
Fig. 4
Fig. 4
GABA-related transcript expression levels after removal of subject pairs with potential confounding factors. The mean (hash mark) and individual (circle) 2–dCt relative expression values are plotted by diagnostic group for (a) parvalbumin (PV) mRNA and (b–d) somatostatin (SST) mRNA. Note the varying scales for the y axes between (a) and (b–d). Subjects with bipolar disorder (BPD) that had antipsychotic medication use at the time of death and their matched controls (Con) were removed and the subjects with BPD (n = 12) demonstrated a trending reduction in PV mRNA expression (a). Subjects with major depressive disorder (MDD) that were using benzodiazepines or sodium valproate at the time of death and their matched controls were removed and the subjects with MDD (n = 15) demonstrated a significant reduction of SST mRNA expression (b). Subjects with BPD (c) or MDD (d) that were using SSRIs at the time of death and their matched controls were removed and the subjects with MDD (n = 14) demonstrated a significant reduction of SST mRNA expression (d) while the subjects with BPD (n = 10) did not demonstrate a significant alteration in SST mRNA expression (c).
Fig. 5
Fig. 5
Reduced somatostatin (SST) precursor protein levels in major depressive disorder (MDD) and no changes in bipolar disorder (BPD). (a) SST precursor protein relative immunoreactivity migrated at the expected ~14 kDa size, and (b) displayed a dose-dependent decrease between WT, SST-HZ and SST-KO mice. (c) Non-related lanes were removed for direct comparison. Examples of control (C) and MDD paired samples run on the same gel. Relative levels (compared to actin) are presented in control vs. (d) MDD and (e) BPD subjects. Data points below the no-change line represent low expression in the disease cohort. Blue dots indicate the mean group differences. Quantitative results and statistics are presented in the text.

References

    1. Akbarian S, Huang HS. Molecular and cellular mechanisms of altered GAD1/GAD67 expression in schizophrenia and related disorders. Brain Research Reviews. 2006;52:293–304. - PubMed
    1. Ansorge MS, Zhou M, Lira A, Hen R, et al. Early-life blockade of the 5-HT transporter alters emotional behavior in adult mice. Science. 2004;306:879–881. - PubMed
    1. APA . Diagnostic and Statistical Manual of Mental Disorders. 4th edn. American Psychiatric Association; Washington, DC: 1994.
    1. Beasley CL, Zhang ZJ, Patten I, Reynolds GP. Selective deficits in prefrontal cortical GABAergic neurons in schizophrenia defined by the presence of calcium-binding proteins. Biological Psychiatry. 2002;52:708–715. - PubMed
    1. Cahir M, Costello I, King DJ, Reynolds GP. Chronic haloperidol or clozapine treatment does not alter parvalbumin immunoreactivity in the rat frontal cortex or hippocampus. Neuroscience Letters. 2005;373:57–60. - PubMed

Publication types

MeSH terms