Comparative Study
. 2011 Apr;337(1):65-74.
doi: 10.1124/jpet.110.174573. Epub 2011 Jan 12.

Aborted autophagy and nonapoptotic death induced by farnesyl transferase inhibitor and lovastatin

Affiliations
Comparative Study

Aborted autophagy and nonapoptotic death induced by farnesyl transferase inhibitor and lovastatin

Jonathan W Wojtkowiak et al. J Pharmacol Exp Ther. 2011 Apr.

Abstract

Exposure of the human malignant peripheral nerve sheath tumor cell lines STS-26T, ST88-14, and NF90-8 to nanomolar concentrations of both lovastatin and farnesyl transferase inhibitor (FTI)-1 but not to either drug alone induced cell death. ST88-14 and NF90-8 cells underwent apoptosis, yet dying STS-26T cells did not. FTI-1 cotreatment induced a strong and sustained autophagic response as indicated by analyses of microtubule-associated protein-1 light chain 3 (LC3)-II accumulation in STS-26T cultures. Extensive colocalization of LC3-positive punctate spots was observed with both lysosome-associated membrane protein (LAMP)-1 and LAMP-2 (markers of late endosomes/lysosomes) in solvent or FTI-1 or lovastatin-treated STS-26T cultures but very little colocalization in lovastatin/FTI-1-cotreated cultures. The absence of colocalization in the cotreatment protocol correlated with loss of LAMP-2 expression. Autophagic flux studies indicated that lovastatin/FTI-1 cotreatment inhibited the completion of the autophagic program. In contrast, rapamycin induced an autophagic response that was associated with cytostasis but maintenance of viability. These studies indicate that cotreatment of STS-26T cells with lovastatin and FTI-1 induces an abortive autophagic program and nonapoptotic cell death.


Figures

Fig. 1.
Fig. 1.
Suppression of prenylation by FTI-1 and lovastatin cotreatment. STS-26T cultures were treated as indicated for 24 h before being harvested and processed for Western blot analyses of Ras and Rab5 (A) and Rheb (B) prenylation status. Unprenylated Ras, Rab5, and Rheb migrate more slowly on SDS gels and appear as an upper band. Cultures in B were transiently transfected with Flag-Rheb for 24 h before treatment. Analyses are of 25 μg of protein/lane. Similar results were obtained in two additional experiments for Ras and Rab5 prenylation and one additional experiment for Rheb prenylation.
Fig. 2.
Fig. 2.
Cytostatic and cytotoxic effects of FTI-1 and lovastatin cotreatment. STS-26T cells were plated 24 h before being treated with solvent, lovastatin, FTI-1, or a combination of FTI-1 plus lovastatin. Cultures were harvested at various times after treatment for assessment of cell numbers (A) and viability (B) or 48 h after treatment for FACS analyses of DNA contents (C). Data in A and B are the mean ± S.D. of triplicate samples and are representative of three independent experiments. The data in C represent 104 gated events and are representative of three independent experiments.
Fig. 3.
Fig. 3.
Procaspase activation by FTI-1 and lovastatin cotreatment. STS-26T cells were plated 24 h before drug treatments. A, cultures were treated with lovastatin, FTI-1, or a combination of lovastatin and FTI-1 for the indicated times before being harvested and processed for analyses of DEVDase activities. B, cultures were treated with 25 μM HA14-1 for the indicated times before being harvested and processed for analyses of DEVDase activities. Data in A and B represent mean of triplicate replicants. Similar results were obtained in two additional experiments. C, STS-26T cultures were treated as indicated and then were harvested and processed for Western blot analyses of procaspase-3 cleavage. As positive controls, STS-26T cultures were treated with HA14-1 and NF90-8 cells were treated with lovastatin plus FTI-1 before being harvested for analyses of procaspase-3 cleavage. Analyses are of 25 μg of protein/lane.
Fig. 4.
Fig. 4.
FTI-1 and lovastatin cotreatment induce autophagy. A, STS-26T, ST88-14, and NF90-8 MPNST cultures were treated with solvent or FTI-1 + lovastatin and harvested at the indicated times for analyses of LC3 expression by Western blot analyses. B, STS-26T cultures were treated with lovastatin, FTI-1, or a combination of the two drugs for 16 to 66 h before being harvested for analyses of LC3. C, STS-26T cultures were treated with or without 10 μΜ E64D and 10 μΜ pepstatin A for 2 h before the addition of FTI-1, lovastatin, or FTI-1 + lovastatin. Cultures were harvested 24 h later for Western blot analyses of LC3 and estimates of “autophagic flux.” Similar results were obtained in two additional studies. D, STS-26T cells were subjected to 6 h of incubation in leucine-free media; 48 h of DMSO, 500 nM GGTI-2Z, or 500 nM FTI-1 either alone or in combination with 500 nM lovastatin as indicated; and in the presence or absence of 50 nM bafilomycin A1 for the final 2 h of the culture. Whole-cell lysates were then separated on SDS-PAGE gels and analyzed for LC3 and β-tubulin expression.
Fig. 5.
Fig. 5.
Rapamycin induces autophagy and is cytostatic in STS-26T cells. A, STS-26T cultures were treated as indicated and harvested for analyses of cell numbers. B, STS-S6T cells were treated as shown for 48 h and then harvested, counted, and 3 × 10³ cells of each condition were replated in fresh growth media without any inhibitors. After a further 48 or 72 h of culture, colonies containing four or more cells were counted in 10 randomly selected fields of each culture. Data are the mean ± S.D. of triplicate samples and are representative of two independent experiments. C, STS-26T cultures were treated as indicated. Whole-cell lysates were prepared and probed for LC3-II expression by Western blot analysis.
Fig. 6.
Fig. 6.
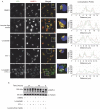
Colocalization of LC3 and LAMP-1 in FTI-1 and lovastatin cotreated cultures. A, STS-26T cultures were treated with DMSO, 500 nM lovastatin, 500 nM FTI-1, or FTI-1 plus lovastatin for 48 h before processing of cultures to analyze colocalization of LC3 with LAMP-1. Nuclei were stained with DAPI. Parallel cultures were shifted to a leucine-free media for 6 h to intentionally induce autophagy. Colocalization of LC3 with LAMP-1 is indicated by punctate orange-yellow fluorescence in merged images or congruence of the patterns of valleys and peaks in overlaid scans of the red and green channels. B, STS-26T cultures were treated with lovastatin, FTI-1, or lovastatin plus FTI-1 for either 24 or 48 h or shifted to a leucine-free media for 6 h before being processed for quantification of LAMP-1 expression by Western blot analysis.
Fig. 7.
Fig. 7.
Colocalization of LC3 and LAMP-2 in FTI-1- and lovastatin-cotreated cultures. A, STS-26T cultures were treated with DMSO, 500 nM lovastatin, 500 nM FTI-1, or FTI-1 plus lovastatin for 48 h before processing of cultures to analyze colocalization of LC3 with LAMP-2. Nuclei were stained with DAPI. Parallel cultures were shifted to a leucine-free media for 6 h to intentionally induce autophagy. Colocalization of LC3 with LAMP-2 is indicated by punctate orange-yellow fluorescence in merged images or congruence of the patterns of valleys and peaks in overlaid scans of the red and green channels. B, STS-26T cultures were treated with lovastatin, FTI-1, or lovastatin plus FTI-1 for either 24 or 48 h or shifted to a leucine-free media for 6 h before being processed for quantification of LAMP-2 expression by Western blot analysis.

References

    1. Adjei AA. (2005) Farnesyltransferase inhibitors. Cancer Chemother Biol Response Modif 22:123–133 - PubMed
    1. Amaravadi RK, Yu D, Lum JJ, Bui T, Christophorou MA, Evan GI, Thomas-Tikhonenko A, Thompson CB. (2007) Autophagy inhibition enhances therapy-induced apoptosis in a Myc-induced model of lymphoma. J Clin Invest 117:326–336 - PMC - PubMed
    1. Araki M, Motojima K. (2008) Hydrophobic statins induce autophagy in cultured human rhabdomyosarcoma cells. Biochem Biophys Res Commun 367:462–467 - PubMed
    1. Basso AD, Mirza A, Liu G, Long BJ, Bishop WR, Kirschmeier P. (2005) The farnesyl transferase inhibitor (FTI) SCH66336 (lonafarnib) inhibits Rheb farnesylation and mTOR signaling. Role in FTI enhancement of taxane and tamoxifen anti-tumor activity. J Biol Chem 280:31101–31108 - PubMed
    1. Berg TO, Fengsrud M, Strømhaug PE, Berg T, Seglen PO. (1998) Isolation and characterization of rat liver amphisomes. Evidence for fusion of autophagosomes with both early and late endosomes. J Biol Chem 273:21883–21892 - PubMed

Publication types