. 2011 Mar;10(3):M110.001784.
doi: 10.1074/mcp.M110.001784. Epub 2011 Jan 12.

Identification of MST1/STK4 and SULF1 proteins as autoantibody targets for the diagnosis of colorectal cancer by using phage microarrays

Affiliations

Identification of MST1/STK4 and SULF1 proteins as autoantibody targets for the diagnosis of colorectal cancer by using phage microarrays

Ingrid Babel et al. Mol Cell Proteomics. 2011 Mar.

Abstract

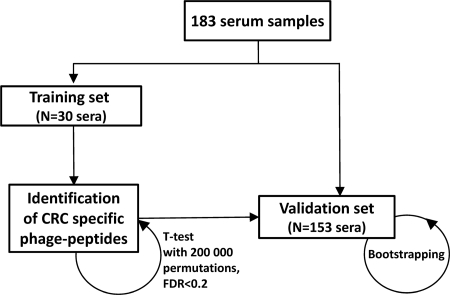
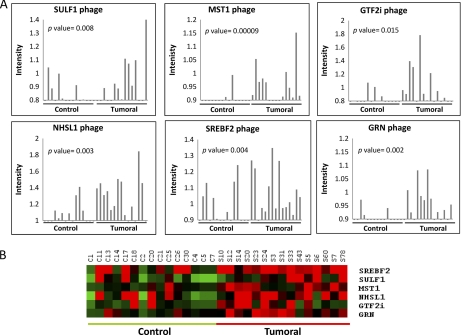
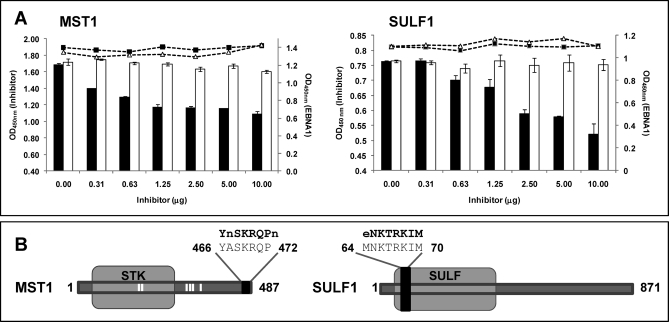
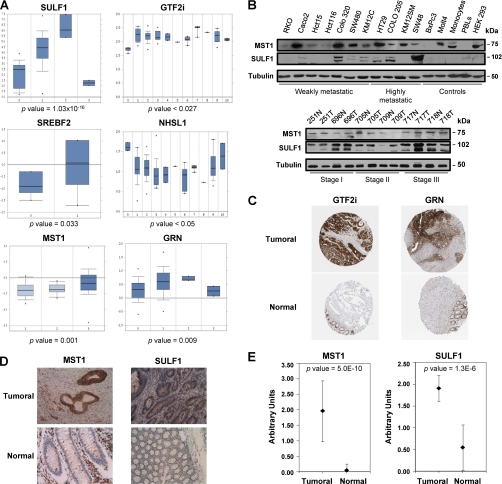
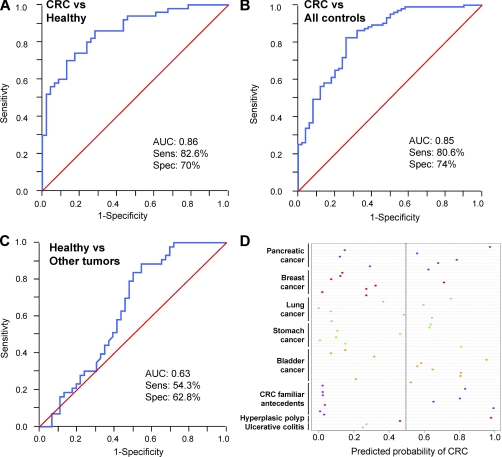
The characterization of the humoral response in cancer patients is becoming a practical alternative to improve early detection. We prepared phage microarrays containing colorectal cancer cDNA libraries to identify phage-expressed peptides recognized by tumor-specific autoantibodies from patient sera. From a total of 1536 printed phages, 128 gave statistically significant values to discriminate cancer patients from control samples. From this, 43 peptide sequences were unique following DNA sequencing. Six phages containing homologous sequences to STK4/MST1, SULF1, NHSL1, SREBF2, GRN, and GTF2I were selected to build up a predictor panel. A previous study with high-density protein microarrays had identified STK4/MST1 as a candidate biomarker. An independent collection of 153 serum samples (50 colorectal cancer sera and 103 reference samples, including healthy donors and sera from other related pathologies) was used as a validation set to study prediction capability. A combination of four phages and two recombinant proteins, corresponding to MST1 and SULF1, achieved an area under the curve of 0.86 to correctly discriminate cancer from healthy sera. Inclusion of sera from other different neoplasias did not change significantly this value. For early stages (A+B), the corrected area under the curve was 0.786. Moreover, we have demonstrated that MST1 and SULF1 proteins, homologous to phage-peptide sequences, can replace the original phages in the predictor panel, improving their diagnostic accuracy.


Figures

Fig. 1.
Fig. 1.
Overview of the process followed for the identification and validation of potential biomarkers to diagnose colorectal cancer using phage microarrays.
Fig. 2.
Fig. 2.
Autoantibody response to six CRC-specific phages. A, Microarray signal intensity of cancer and control sera against each phage, following normalization of each serum, in arbitrary units (a.u.). B, Heatmap representation of the microarray signal intensity for the six phages.
Fig. 3.
Fig. 3.
Competition analysis between phage-peptides and homologous proteins. A, A competition ELISA was performed between phages displaying peptides with homology to SULF1 and MST1 and the full-length proteins. GST was used as negative control. Increasing amounts of the recombinant proteins were pre-incubated with the sera and then tested for antibody binding to the phage (vertical bars: black, recombinant protein; white, GST). In the scatter plot, the IgG binding to EBNA1 of the same sera, pre-incubated with increased amounts of recombinant proteins is represented. EBNA 1 was used as a control to demonstrate that the inhibition was protein-specific and no bias was introduced in the experiment (black squares, recombinant protein; white triangles, GST). The Optical Density (OD) at 450 nm of both assays is represented in the figure. Error bars represent standard deviation of three separate experiments. B, Localization of the peptides with homology to SULF1 and MST1 in the full length proteins. Phage-displayed peptide is shown as a black box. White bars correspond to potential phosphorylation sites. Amino acids that were different between the phage-peptide and the wild-type protein are represented in small letter.
Fig. 4.
Fig. 4.
Analysis of SULF1, MST1, GTF2i, NHSL1, GRN, and SREBF2 expression in CRC tissues. A, Meta-analysis of gene expression levels corresponding to the proteins homologous to the phage-displayed peptides was assessed by using the Oncomine database. p values are also indicated. Relative gene expression levels were found for NHSL1, SREBF2, GTF2i, SULF1, MST1, and GRN. B, Western blot analysis of SULF1 and MST1 overexpression in tumoral cell lines and paired cancer tissues corresponding to stages A(I), B(II), and C(III). Tubulin was used as a control. C, Tissue microarray data of GTF2i and GRN expression were retrieved from the Human Protein Atlas. D, MST1/STK4 and SULF1 showed intense cytoplasmic staining in well-differentiated enteroid adenocarcinoma of the right colon, whereas normal colonic mucosa far from the tumor was not stained with the antibody. As internal control, we used the positivity of the inflammatory cells in the lamina propria (MST1/STK4 intense staining and SULF1 mild staining). Images were taken at a 200× magnification. E, Immunohistochemistry results for MST1/STK4 and SULF1 in CRC tissue and the normal mucosa of 25 CRC patients were quantified by two pathologists according to the following criteria: 0, no staining; 1, weak staining; 2, normal staining; 3, strong staining. Error bars represent the S.D. of the assay. p values are indicated.
Fig. 5.
Fig. 5.
Validation of the combination of four phages with MST1 and SULF1 proteins in the diagnosis of colorectal cancer. Performance of the combination of GTF2i, NHSL1, GRN, and SREBF2-like phages and MST1 and SULF1 proteins in the validation set. Receiver-operating-characteristic curves are based on multiplex analyses of the four phages and two proteins from a total of 153 samples (50 samples from CRC patients, 46 healthy controls, 10 samples from controls with CRC familiar antecedents, 2 from ulcerative colitis patients, 2 from patients with hyperplasic polyp, and 43 samples from patients with bladder, breast, lung, pancreatic or stomach cancer). A, Performance of CRC samples versus healthy controls. B, Performance of CRC samples versus all reference sera. C, Performance of healthy sera versus other tumors sera. D, Dotplot showing individual probability of being classified as CRC patient for each of the subjects with different pathologies. The predicted probability is the predicted probability from the final logistic regression model (to differentiate between CRC and reference subjects) following variable selection. Most of the samples were classified below the 0.5 threshold probability (gray line). Therefore, the model did not detect general markers for cancer or inflammatory disease, but particular markers of CRC.

References

    1. Edwards B. K., Ward E., Kohler B. A., Eheman C., Zauber A. G., Anderson R. N., Jemal A., Schymura M. J., Lansdorp-Vogelaar I., Seeff L. C., van Ballegooijen M., Goede S. L., Ries L. A. (2010) Annual report to the nation on the status of cancer, 1975–2006, featuring colorectal cancer trends and impact of interventions (risk factors, screening, and treatment) to reduce future rates. Cancer 116, 544–573 - PMC - PubMed
    1. Winawer S. J. (2007) The multidisciplinary management of gastrointestinal cancer. Colorectal cancer screening. Best Pract. Res. Clin. Gastroenterol. 21, 1031–1048 - PubMed
    1. Duffy M. J., van Dalen A., Haglund C., Hansson L., Holinski-Feder E., Klapdor R., Lamerz R., Peltomaki P., Sturgeon C., Topolcan O. (2007) Tumour markers in colorectal cancer: European Group on Tumour Markers (EGTM) guidelines for clinical use. Eur. J. Cancer 43, 1348–1360 - PubMed
    1. Barderas R., Babel I., Casal J. I. (2010) Colorectal cancer proteomics, molecular characterization and biomarker discovery. Proteomics Clin. Appl. 4, 159–178 - PubMed
    1. Babel I., Barderas R., Diaz-Uriarte R., Martinez-Torrecuadrada J. L., Sánchez-Carbayo M., Casal J. I. (2009) Identification of tumor-associated autoantigens for the diagnosis of colorectal cancer in serum using high density protein microarrays. Mol. Cell Proteomics 8, 2382–2395 - PMC - PubMed

Publication types

MeSH terms