. 2010 Dec 29:4:232.
doi: 10.3389/fnhum.2010.00232. eCollection 2010.

Deconstructing the "resting" state: exploring the temporal dynamics of frontal alpha asymmetry as an endophenotype for depression

Affiliations

Deconstructing the "resting" state: exploring the temporal dynamics of frontal alpha asymmetry as an endophenotype for depression

John J B Allen et al. Front Hum Neurosci. .

Abstract

Asymmetry in frontal electrocortical alpha-band (8-13 Hz) activity recorded during resting situations (i.e., in absence of a specific task) has been investigated in relation to emotion and depression for over 30 years. This asymmetry reflects an aspect of endogenous cortical dynamics that is stable over repeated measurements and that may serve as an endophenotype for mood or other psychiatric disorders. In nearly all of this research, EEG activity is averaged across several minutes, obscuring transient dynamics that unfold on the scale of milliseconds to seconds. Such dynamic states may ultimately have greater value in linking brain activity to surface EEG asymmetry, thus improving its status as an endophenotype for depression. Here we introduce novel metrics for characterizing frontal alpha asymmetry that provide a more in-depth neurodynamical understanding of recurrent endogenous cortical processes during the resting-state. The metrics are based on transient "bursts" of asymmetry that occur frequently during the resting-state. In a sample of 306 young adults, 143 with a lifetime diagnosis of major depressive disorder (62 currently symptomatic), three questions were addressed: (1) How do novel peri-burst metrics of dynamic asymmetry compare to conventional fast-Fourier transform-based metrics? (2) Do peri-burst metrics adequately differentiate depressed from non-depressed participants? and, (3) what EEG dynamics surround the asymmetry bursts? Peri-burst metrics correlated with traditional measures of asymmetry, and were sensitive to both current and past episodes of major depression. Moreover, asymmetry bursts were characterized by a transient lateralized alpha suppression that is highly consistent in phase across bursts, and a concurrent contralateral transient alpha enhancement that is less tightly phase-locked across bursts. This approach opens new possibilities for investigating rapid cortical dynamics during resting-state EEG.

Keywords: EEG asymmetry; EEG dynamics; depression; endophenotype; resting-state.


Figures

Figure 1
Figure 1
Flowchart of participant screening and enrollment. Note: BDI, Beck depression inventory; LOC, loss of consciousness; MDD, major depressive disorder; PTSD, posttraumatic stress disorder; NOS, not otherwise specified; OCD, obsessive compulsive disorder; GAD, generalized anxiety disorder; ADHD, attention deficit hyperactivity disorder. After Stewart et al. (2010).
Figure 2
Figure 2
Schematic depiction of the data reduction steps for the conventional EEG asymmetry data reduction. (A) depicts a 10-s segment of raw data from a single channel on the left, and the spectral representation of this epoch on the right. (B) illustrates the process of epoching the longer segment into shorter overlapping 2 s epochs. (C) depicts the impact of the Hamming window (dotted bell curve) on a single epoch, with the gray line representing the raw signal and the black line representing the signal after the application of the window. Panel D illustrates the extraction of individual power spectra via FFT, and finally the averaging of those spectra across epochs. The top nine gray lines are the spectral representation of nine 2 s epochs, and the lower black line is the average spectrum. Note that alpha power (8–13 Hz) is somewhat variable from epoch to epoch, but that the average spectrum reveals a distinct alpha peak. Vertical axis in (D) is power in microvolts-squared. Figure modeled after Allen et al. (2004a).
Figure 3
Figure 3
Schematic depiction of the identification of asymmetrical bursts in the ongoing resting EEG session. Sites F5 and F6 were chosen based on previous findings as the sites of interest. Top row depicts 5 s of data after current-source density transformation. Next row is alpha-band (8–13 Hz) filtered version of the same data. The natural log of squared Hilbert-transformed alpha-band-pass filtered signals is depicted in the third row. Finally, the subtraction (Right–Left) of these two signals is depicted in the bottom panel, revealing the dynamic nature of frontal alpha asymmetry, with bursts identified by the red circles, and lines linking to the corresponding features in the right or left channel. The leftmost two bursts in this bottom panel are positive bursts, and the rightmost two bursts are negative bursts. Vertical axis for the upper two rows is μV/cm2, and for the bottom two rows is log-μV2/cm2.
Figure 4
Figure 4
Correlation of peri-burst alpha power at sites F5 and F6 with the conventional FFT-derived metrics of power over the entire scalp. Correlations are shown separately for positive bursts (top row) and negative bursts (bottom row). All individual site power values (both conventional and peri-burst power) were natural-log transformed prior to correlation, in keeping with the tradition of log-transformed power values in the EEG asymmetry literature. Against the backdrop of modest positive correlations, reflecting global power differences between subjects, there is anatomical specificity such that peri-burst power from F5 correlates most highly with conventional FFT power at F5, and similarly for these metrics at F6. This anatomical specificity is, in part, due to the effective high-pass spatial filter provided by CSD transformation. Note that the range of correlations differs such that positive bursts for F5 and negative bursts for F6 are on a common scale, and negative bursts for F5 and positive bursts for F6 are on a common scale. Maps were constructed by mapping Pearson correlations using the function topoplot from EEGLab (Delorme and Makeig, 2004).
Figure 5
Figure 5
Correlations of peri-burst alpha asymmetry from sites F5 and F6 [ln(F6)−ln(F5)] with the conventional FFT-derived asymmetry score from all homologous EEG sites [ln(Right)−ln(Left)]. Correlations are shown separately for positive bursts (top left) and negative bursts (bottom left) and combined (right). Because asymmetry scores are difference scores, only one side of the head is depicted, as the opposite side would show identical topography. Anatomical specificity is observed for positive and negative bursts, and all bursts combined, but note that the scale for the combined is larger than either the positive or negative bursts alone, indicating that combining across both positive and negative bursts produces a metric that is most closely aligned with the conventional asymmetry scores, accounting for 42% of the variance in conventional asymmetry scores at F6–F5. Maps were constructed by mapping Pearson correlations using the function headplot from EEGLab (Delorme and Makeig, 2004).
Figure 6
Figure 6
Correlations of number of positive and negative bursts with the conventional FFT-derived metrics. Left panel: correlation with the asymmetry score from all homologous EEG sites [ln(Right)−ln(Left)]; Right panel: correlations with ln-transformed alpha power at individual sites. Correlations are shown separately for the number of positive bursts (top) and for the number of negative bursts (bottom). A greater number of positive bursts is associated with relatively greater ln(R)−ln(L) FFT-derived asymmetry scores, and less left frontal alpha. A greater number of negative bursts is associated with relatively lower ln(R)−ln(L) FFT-derived asymmetry scores, and less right frontal alpha.
Figure 7
Figure 7
Conventional frontal alpha asymmetry scores as a function of MDD status. Error bars reflect standard error. Y-axis is ln μV2/cm2. Both currently and previously depressed individuals had significantly lower asymmetry scores than never-depressed individuals.
Figure 8
Figure 8
Peri-burst frontal alpha asymmetry scores as a function of MDD status. Error bars reflect standard error. Y-axis is ln μV2/cm2. As with conventional metrics (Figure 7), both currently and previously depressed individuals had significantly lower peri-burst asymmetry scores than never-depressed individuals.
Figure 9
Figure 9
Number of negative bursts as a function of MDD status. Error bars reflect standard error. Both currently and previously depressed individuals had significantly more negative bursts than never-depressed individuals. *p < 0.05; †p < 0.07.
Figure 10
Figure 10
Inter-burst phase coherence as a function of MDD status for positive bursts. The effect of MDD status is episode dependent, with only currently depressed individuals showing enhanced inter-burst phase coherence, and only for left frontal activity.
Figure 11
Figure 11
Topographical distribution of positive (A) and negative (B) bursts for alpha oscillation power and alpha oscillation inter-burst phase coherence.
Figure 12
Figure 12
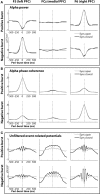
The temporal dynamics of power and inter-burst phase coherence for left (F5) medial (FCz) and right (F6) loci. Bursts were defined based on the power difference ln(F6)−ln(F5), with positive bursts representing extreme positive values on this metric, and negative bursts representing extreme negative values on this metric. (A) displays peri-burst alpha power; (B) displays inter-burst phase coherence; (C) displays event-related potentials, created by time-locking unfiltered EEG to each burst.
Figure 13
Figure 13
The oscillatory dynamics of a wider frequency range for sites F5 and F6, displayed as a function of positive and negative bursts.
Figure 14
Figure 14
The oscillatory dynamics of a wider frequency range for sites F5 and F6, as a function of positive and negative bursts, depicted separately for eyes-open and eyes-closed epochs. Clear alpha modulation surrounds each burst, with F5 and F6 revealing effects of similar size but opposite direction. These effects are highly consistent across both eyes-open (A) and eyes-closed (B) conditions, but a relative theta-band suppression accompanying both positive and negative bursts is seen only in the eyes-open (A) condition.
Figure 15
Figure 15
Topographical distribution of theta (4–7 Hz) activity during eyes-open condition. The scalp topography of theta-band (4–7 Hz) power preceding and following the bursts is highly consistent for both positive (A) and negative (B) bursts, with relative theta-band suppression occurring at frontal and lateral frontal regions surrounding the time of the alpha asymmetry bursts.

References

    1. Accortt E. E., Allen J. J. (2006). Frontal EEG asymmetry and premenstrual dysphoric symptomatology. J. Abnorm. Psychol. 115, 179–18410.1037/0021-843X.115.1.179 - DOI - PubMed
    1. Allen J. J., Harmon-Jones E., Cavender J. H. (2001). Manipulation of frontal EEG asymmetry through biofeedback alters self-reported emotional responses and facial EMG. Psychophysiology 38, 685–69310.1111/1469-8986.3840685 - DOI - PubMed
    1. Allen J. J., Iacono W. G., Depue R. A., Arbisi P. (1993). Regional electroencephalographic asymmetries in bipolar seasonal affective disorder before and after exposure to bright light. Biol. Psychiatry 33, 642–64610.1016/0006-3223(93)90104-L - DOI - PubMed
    1. Allen J. J., Kline J. P. (2004). Frontal EEG asymmetry, emotion, and psychopathology: the first, and the next 25 years. Biol. Psychol. 67, 1–510.1016/j.biopsycho.2004.03.001 - DOI - PubMed
    1. Allen J. J. B., Coan J. A., Nazarian M. (2004a). Issues and assumptions on the road from raw signals to metrics of frontal EEG asymmetry in emotion. Biol. Psychol. 67, 183–21810.1016/j.biopsycho.2004.03.007 - DOI - PubMed