

Characterization of the mechanisms of the increase in PPARδ expression induced by digoxin in the heart using the H9c2 cell line
- PMID: 21232041
- PMCID: PMC3087139
- DOI: 10.1111/j.1476-5381.2011.01212.x
Characterization of the mechanisms of the increase in PPARδ expression induced by digoxin in the heart using the H9c2 cell line
Abstract
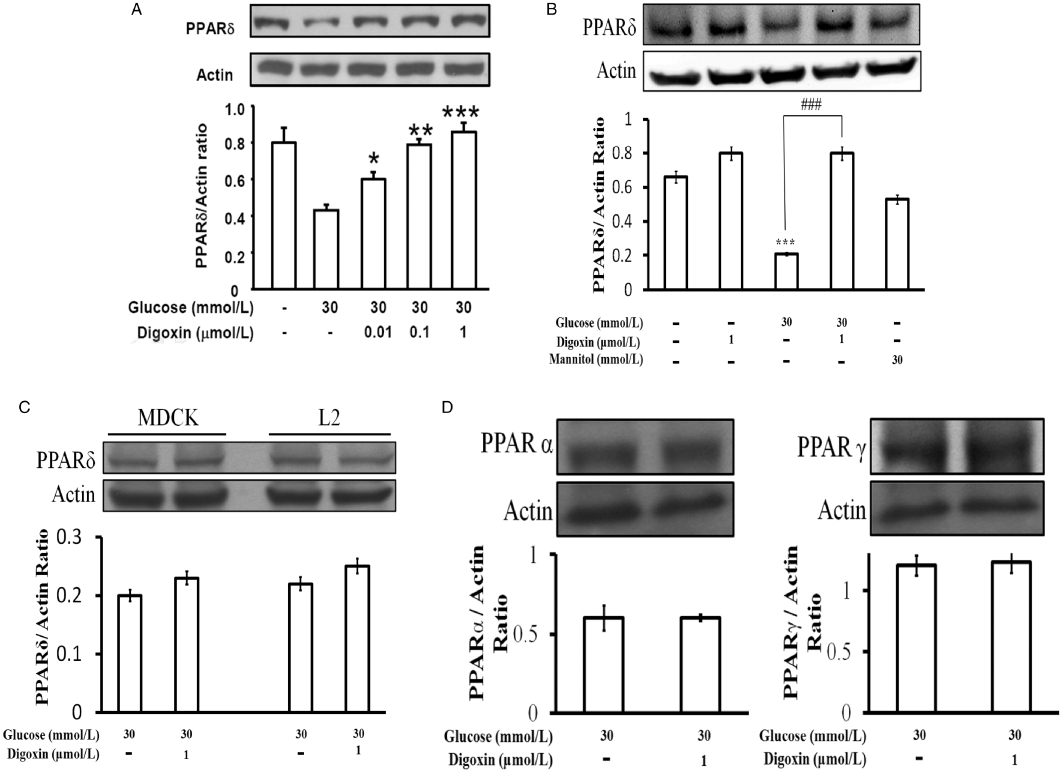
Background and purpose: Digoxin has been used as an inotropic agent in heart failure for a long time. Troponin I (TnI) phosphorylation is related to cardiac contractility, and the genes are regulated by peroxisome proliferator-activated receptors (PPARs). Our previous studies indicated that cardiac abnormality related to the depressed expression of PPARδ in the hearts of STZ rats is reversed by digoxin. However, the cellular mechanisms for this effect of digoxin have not been elucidated. The aim of the present study was to investigate possible mechanisms for this effect of digoxin using the H9c2 cell line cultured in high glucose (HG) conditions.
Methods: The effects of digoxin on PPARδ expression, intracellular calcium and TnI phosphorylation were investigated in cultured H9c2 cells, maintained in a HG medium, by using Western blot analysis.
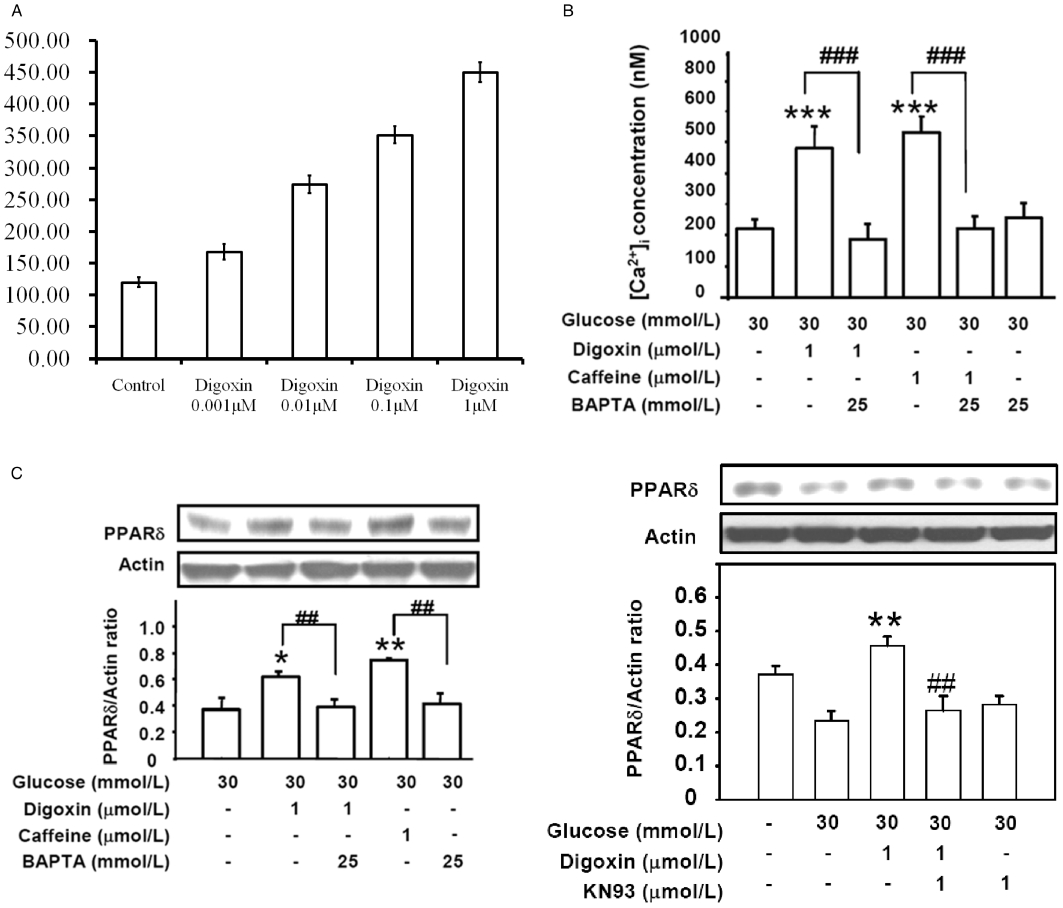
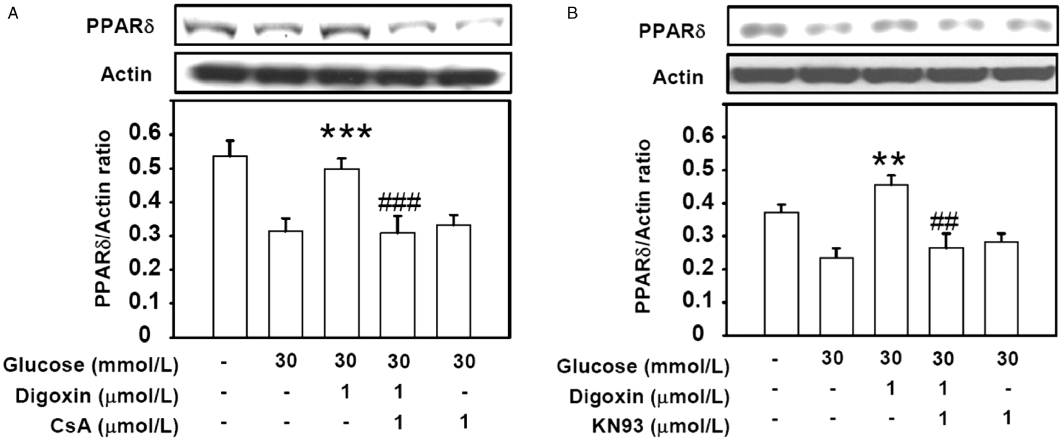
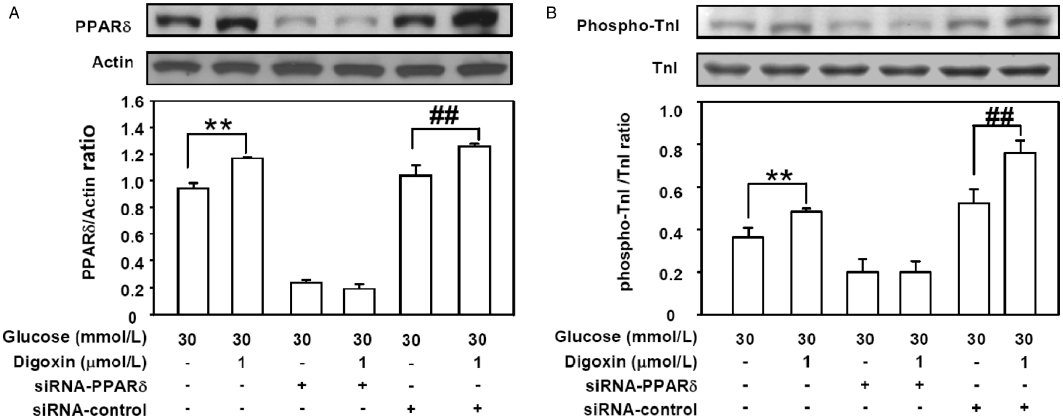
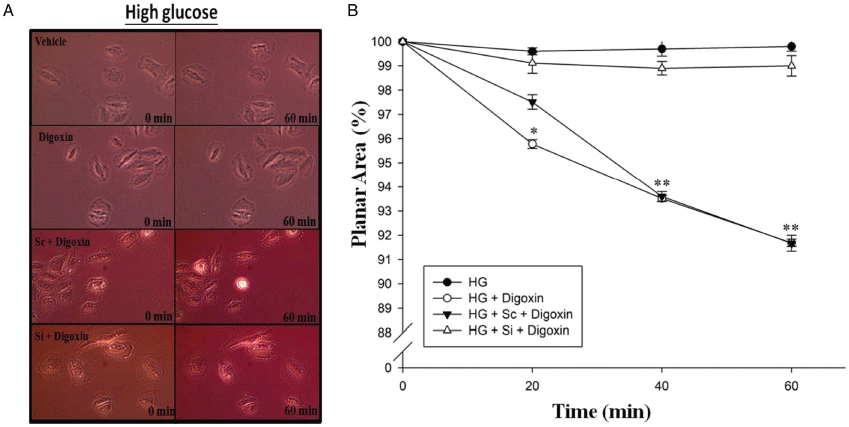
Results: Digoxin increased PPARδ expression in H9c2 cells subjected to HG conditions, and increase the intracellular calcium concentration. This effect of digoxin was blocked by BAPTA-AM at concentrations sufficient to chelate calcium ions. In addition, the calcineurin inhibitor cyclosporine A and KN93, an inhibitor of calcium/calmodulin-dependent protein kinase, inhibited this action. Digoxin also increased TnI phosphorylation and this was inhibited when PPARδ was silenced by the addition of RNAi to the cells. Similar changes were observed on the contraction of H9c2 cells.
Conclusion: The results suggest that digoxin appears, through calcium-triggered signals, to reverse the reduced expression of PPARδ in H9c2 cells caused by HG treatment.
© 2011 The Authors. British Journal of Pharmacology © 2011 The British Pharmacological Society.
Figures
Similar articles
-
Increase of peroxisome proliferator-activated receptor δ (PPARδ) by digoxin to improve lipid metabolism in the heart of diabetic rats.Horm Metab Res. 2013 May;45(5):364-71. doi: 10.1055/s-0032-1330021. Epub 2012 Dec 7. Horm Metab Res. 2013. PMID: 23225238
-
The decreased expression of peroxisome proliferator-activated receptors delta (PPARdelta) is reversed by digoxin in the heart of diabetic rats.Horm Metab Res. 2010 Aug;42(9):637-42. doi: 10.1055/s-0030-1253373. Epub 2010 May 5. Horm Metab Res. 2010. PMID: 20446238
-
Cardiac peroxisome proliferator-activated receptor δ (PPARδ) as a new target for increased contractility without altering heart rate.PLoS One. 2013 May 28;8(5):e64229. doi: 10.1371/journal.pone.0064229. Print 2013. PLoS One. 2013. PMID: 23724037 Free PMC article.
-
Increase of PPARδ by dopamine mediated via DA-1 receptor-linked phospholipase C pathway in neonatal rat cardiomyocytes.Auton Neurosci. 2013 Oct;177(2):211-6. doi: 10.1016/j.autneu.2013.04.013. Epub 2013 May 21. Auton Neurosci. 2013. PMID: 23701913
-
Peroxisome proliferator-activated receptor delta agonists attenuated the C-reactive protein-induced pro-inflammation in cardiomyocytes and H9c2 cardiomyoblasts.Eur J Pharmacol. 2010 Sep 15;643(1):84-92. doi: 10.1016/j.ejphar.2010.06.031. Epub 2010 Jun 28. Eur J Pharmacol. 2010. PMID: 20599914
Cited by
-
Etanercept Ameliorates Cardiac Fibrosis in Rats with Diet-Induced Obesity.Pharmaceuticals (Basel). 2021 Apr 1;14(4):320. doi: 10.3390/ph14040320. Pharmaceuticals (Basel). 2021. PMID: 33916242 Free PMC article.
-
PTX3 from vascular endothelial cells contributes to trastuzumab-induced cardiac complications.Cardiovasc Res. 2023 May 22;119(5):1250-1264. doi: 10.1093/cvr/cvad012. Cardiovasc Res. 2023. PMID: 36651911 Free PMC article.
-
TGR5 activation ameliorates hyperglycemia-induced cardiac hypertrophy in H9c2 cells.Sci Rep. 2019 Mar 6;9(1):3633. doi: 10.1038/s41598-019-40002-0. Sci Rep. 2019. PMID: 30842472 Free PMC article.
-
Live cell screening identifies glycosides as enhancers of cardiomyocyte cell cycle activity.Front Cardiovasc Med. 2022 Sep 26;9:901396. doi: 10.3389/fcvm.2022.901396. eCollection 2022. Front Cardiovasc Med. 2022. PMID: 36225954 Free PMC article.
-
Ginsenoside Rh2 Improves Cardiac Fibrosis via PPARδ-STAT3 Signaling in Type 1-Like Diabetic Rats.Int J Mol Sci. 2017 Jun 26;18(7):1364. doi: 10.3390/ijms18071364. Int J Mol Sci. 2017. PMID: 28672855 Free PMC article.
References
-
- Besch HR, Jr, Watanabe AM. The positive inotropic effect of digitoxin: independence from sodium accumulation. J Pharmacol Exp Ther. 1978;207:958–965. - PubMed
-
- Bootman MD, Berridge MJ. The elemental principles of calcium signaling. Cell. 1995;83:675–678. - PubMed
-
- Chen JS, Lee HS, Jin JS, Chen A, Lin SH, Ka SM, et al. Attenuation of mouse mesangial cell contractility by high glucose and mannitol: involvement of protein kinase C and focal adhesion kinase. J Biomed Sci. 2004;11:142–151. - PubMed
Publication types
MeSH terms
Substances
LinkOut - more resources
Full Text Sources
