

Effects of rosiglitazone on the configuration of action potentials and ion currents in canine ventricular cells
- PMID: 21232044
- PMCID: PMC3101613
- DOI: 10.1111/j.1476-5381.2011.01215.x
Effects of rosiglitazone on the configuration of action potentials and ion currents in canine ventricular cells
Abstract
Background and purpose: In spite of its widespread clinical application, there is little information on the cellular cardiac effects of the antidiabetic drug rosiglitazone in larger experimental animals. In the present study therefore concentration-dependent effects of rosiglitazone on action potential morphology and the underlying ion currents were studied in dog hearts.
Experimental approach: Standard microelectrode techniques, conventional whole cell patch clamp and action potential voltage clamp techniques were applied in enzymatically dispersed ventricular cells from dog hearts.
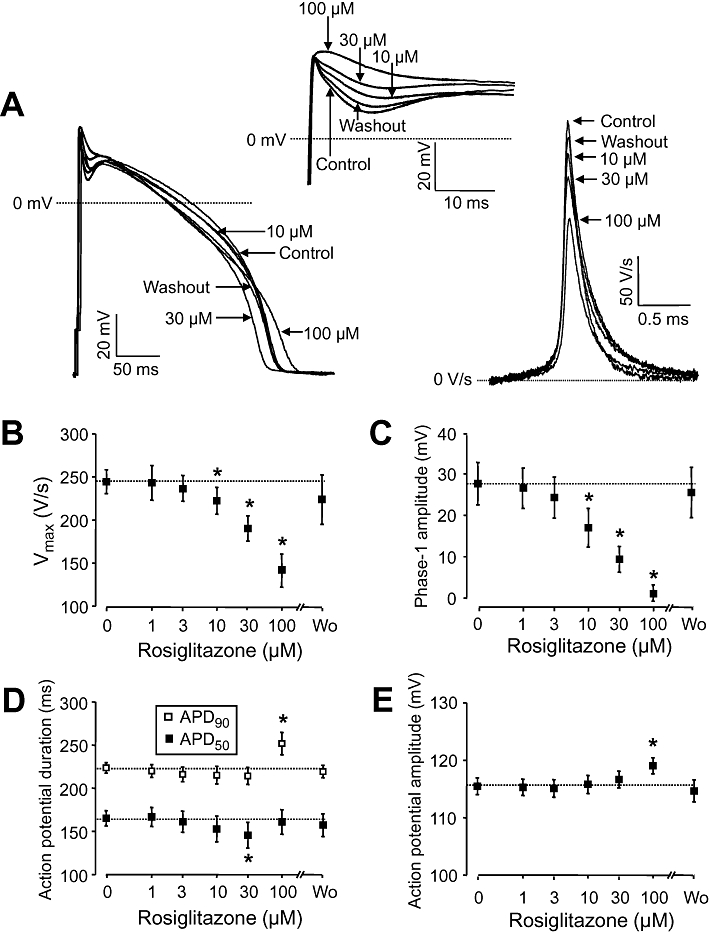
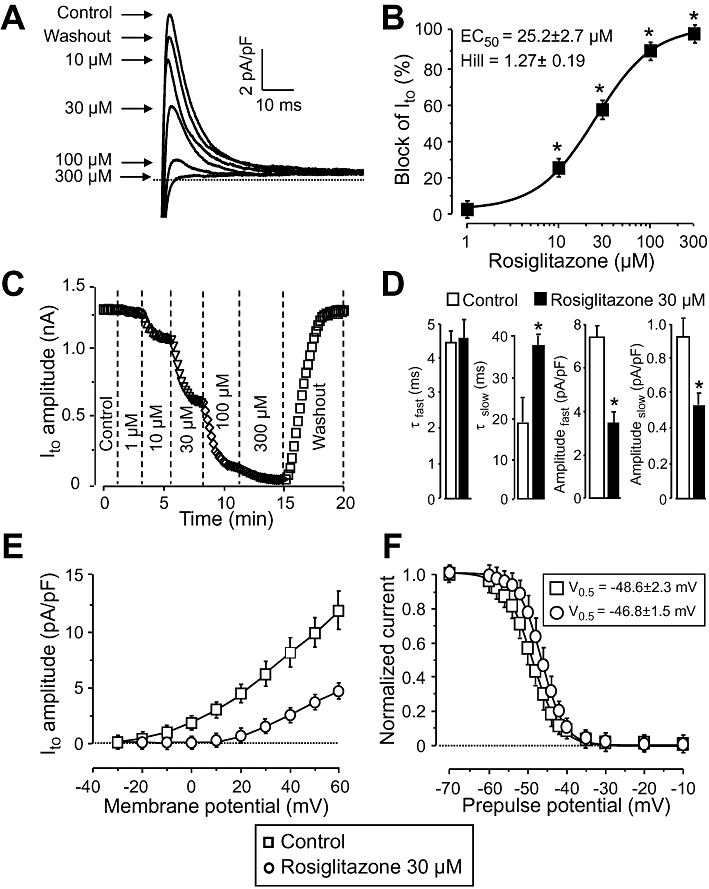
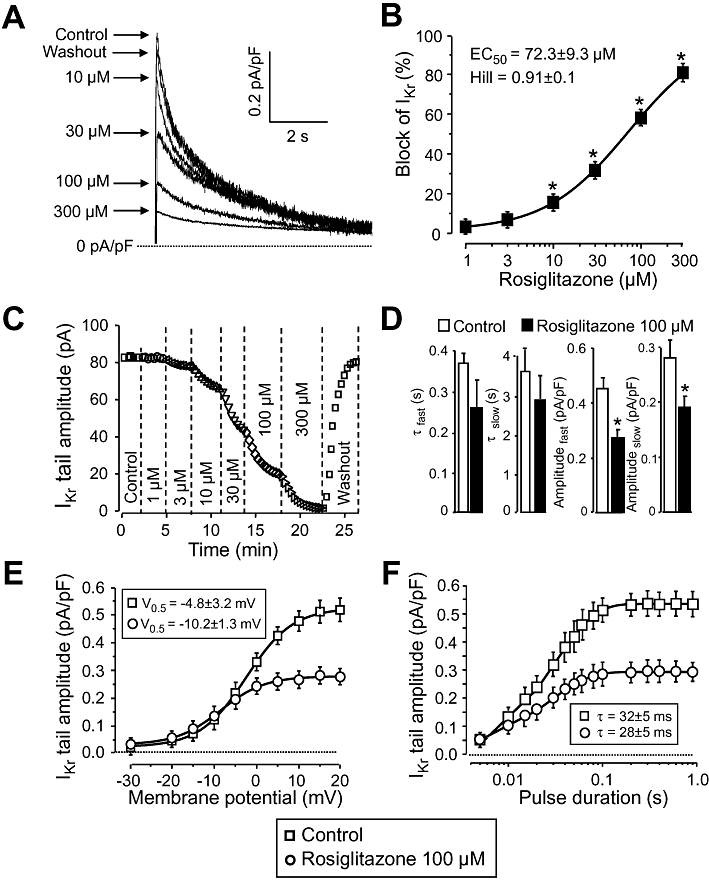
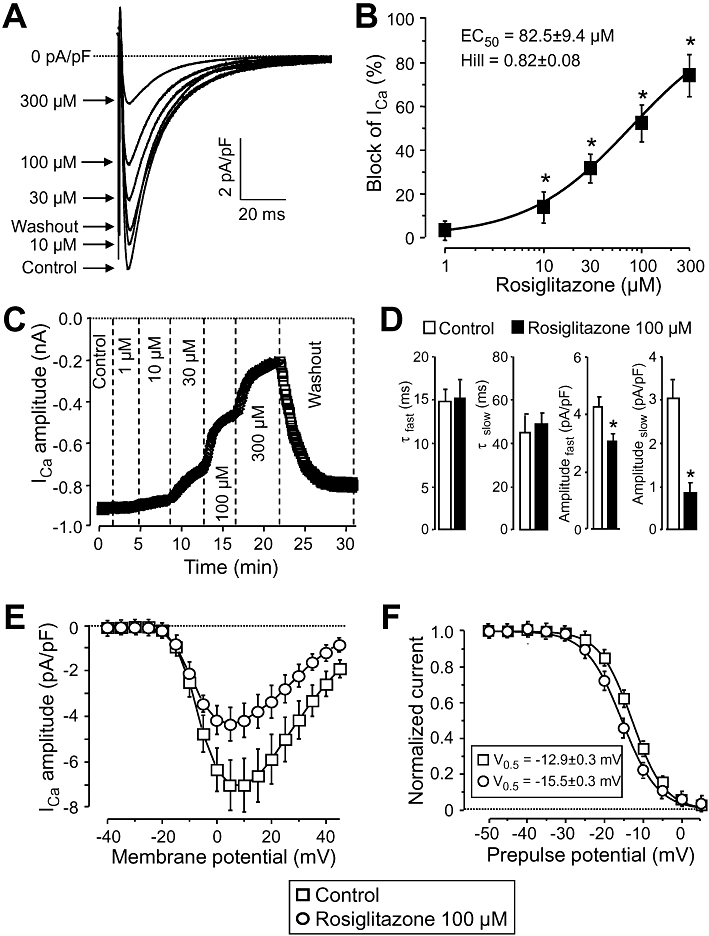
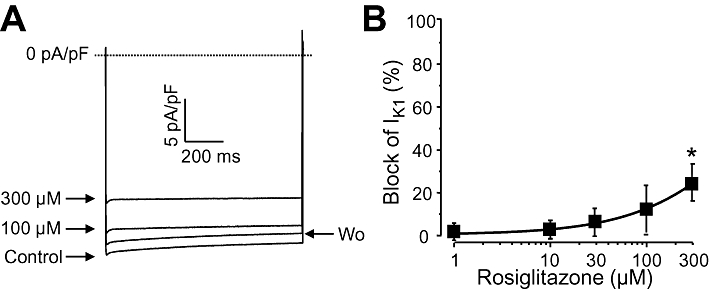
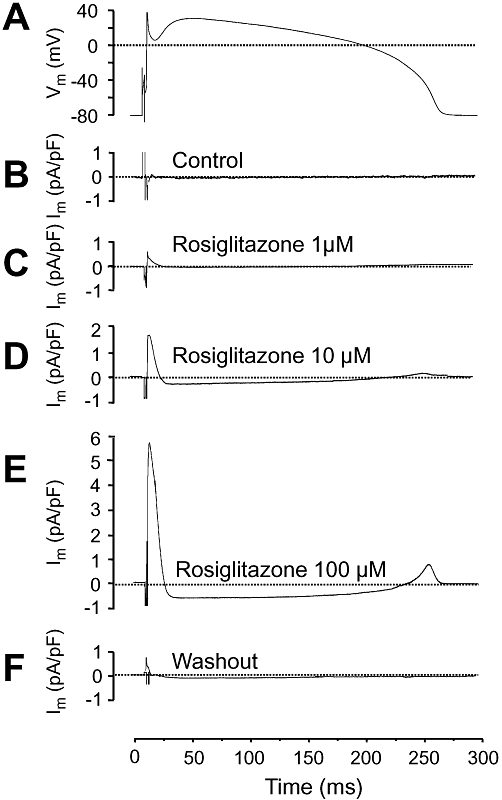
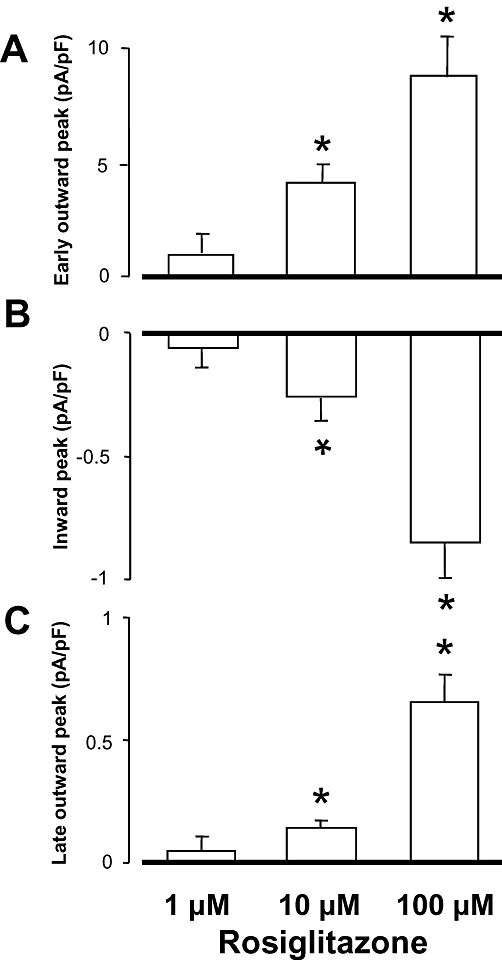
Key results: At concentrations ≥10 µM rosiglitazone decreased the amplitude of phase-1 repolarization, reduced the maximum velocity of depolarization and caused depression of the plateau potential. These effects developed rapidly and were readily reversible upon washout. Rosiglitazone suppressed several transmembrane ion currents, concentration-dependently, under conventional voltage clamp conditions and altered their kinetic properties. The EC(50) value for this inhibition was 25.2 ± 2.7 µM for the transient outward K(+) current (I(to)), 72.3 ± 9.3 µM for the rapid delayed rectifier K(+) current (I(Kr)) and 82.5 ± 9.4 µM for the L-type Ca(2+) current (I(Ca) ) with Hill coefficients close to unity. The inward rectifier K(+) current (I(K1)) was not affected by rosiglitazone up to concentrations of 100 µM. Suppression of I(to), I(Kr), and I(Ca) was confirmed also under action potential voltage clamp conditions.
Conclusions and implications: Alterations in the densities and kinetic properties of ion currents may carry serious pro-arrhythmic risk in case of overdose with rosiglitazone, especially in patients having multiple cardiovascular risk factors, like elderly diabetic patients.
© 2011 The Authors. British Journal of Pharmacology © 2011 The British Pharmacological Society.
Figures
Comment in
-
Cardiac ion channel modulation by the hypoglycaemic agent rosiglitazone.Br J Pharmacol. 2011 Jun;163(3):496-8. doi: 10.1111/j.1476-5381.2011.01281.x. Br J Pharmacol. 2011. PMID: 21561443 Free PMC article.
Similar articles
-
Can the electrophysiological action of rosiglitazone explain its cardiac side effects?Curr Med Chem. 2011;18(24):3720-8. doi: 10.2174/092986711796642364. Curr Med Chem. 2011. PMID: 21774756 Free PMC article.
-
Effects of ropinirole on action potential characteristics and the underlying ion currents in canine ventricular myocytes.Naunyn Schmiedebergs Arch Pharmacol. 2010 Sep;382(3):213-20. doi: 10.1007/s00210-010-0538-1. Epub 2010 Jul 29. Naunyn Schmiedebergs Arch Pharmacol. 2010. PMID: 20668839
-
Effects of articaine on action potential characteristics and the underlying ion currents in canine ventricular myocytes.Br J Anaesth. 2007 Nov;99(5):726-33. doi: 10.1093/bja/aem263. Epub 2007 Sep 24. Br J Anaesth. 2007. PMID: 17895236
-
Effects of ropivacaine on action potential configuration and ion currents in isolated canine ventricular cardiomyocytes.Anesthesiology. 2008 Apr;108(4):693-702. doi: 10.1097/ALN.0b013e3181684b91. Anesthesiology. 2008. PMID: 18362602
-
The impact of single cell voltage clamp on the understanding of the cardiac ventricular action potential.Cardioscience. 1992 Sep;3(3):131-44. Cardioscience. 1992. PMID: 1384746 Review.
Cited by
-
PPAR-γ as a therapeutic target in cardiovascular disease: evidence and uncertainty.J Lipid Res. 2012 Sep;53(9):1738-54. doi: 10.1194/jlr.R024505. Epub 2012 Jun 8. J Lipid Res. 2012. PMID: 22685322 Free PMC article. Review.
-
Experimentally-Based Computational Investigation into Beat-To-Beat Variability in Ventricular Repolarization and Its Response to Ionic Current Inhibition.PLoS One. 2016 Mar 28;11(3):e0151461. doi: 10.1371/journal.pone.0151461. eCollection 2016. PLoS One. 2016. PMID: 27019293 Free PMC article.
-
Computational Identification of Novel Kir6 Channel Inhibitors.Front Pharmacol. 2019 May 24;10:549. doi: 10.3389/fphar.2019.00549. eCollection 2019. Front Pharmacol. 2019. PMID: 31178728 Free PMC article.
-
Role of action potential configuration and the contribution of C²⁺a and K⁺ currents to isoprenaline-induced changes in canine ventricular cells.Br J Pharmacol. 2012 Oct;167(3):599-611. doi: 10.1111/j.1476-5381.2012.02015.x. Br J Pharmacol. 2012. PMID: 22563726 Free PMC article.
-
Minireview: Challenges and opportunities in development of PPAR agonists.Mol Endocrinol. 2014 Nov;28(11):1756-68. doi: 10.1210/me.2013-1427. Epub 2014 Aug 22. Mol Endocrinol. 2014. PMID: 25148456 Free PMC article. Review.
References
-
- Arikawa M, Takahashi N, Kira T, Hara M, Yoshimatsu H, Saikawa T. Attenuated inhibition of L-type calcium currents by troglitazone in fructose-fed rat cardiac ventricular myocytes. J Cardiovasc Pharmacol. 2004;44:109–116. - PubMed
-
- Bányász T, Magyar J, Szentandrássy N, Horváth B, Birinyi P, Szentmiklósi J, et al. Action potential clamp fingerprints of K+ currents in canine cardiomyocytes: their role in ventricular repolarization. Acta Physiol (Scand) 2007;190:189–198. - PubMed
-
- Berger J, Bailey P, Biswas C, Cullinan CA, Doebber TW, Hayes NS, et al. Thiazolidinediones produce a conformational change in peroxisomal proliferator-activated receptor-gamma: binding and activation correlate with antidiabetic actions in db/db mice. Endocrinology. 1996;137:4189–41950. - PubMed
Publication types
MeSH terms
Substances
LinkOut - more resources
Full Text Sources
Medical
Miscellaneous
