. 2011 Apr;50(4):662-9.
doi: 10.1016/j.yjmcc.2010.12.023. Epub 2011 Jan 11.

Complex and rate-dependent beat-to-beat variations in Ca2+ transients of canine Purkinje cells

Affiliations

Complex and rate-dependent beat-to-beat variations in Ca2+ transients of canine Purkinje cells

Young-Seon Lee et al. J Mol Cell Cardiol. 2011 Apr.

Abstract

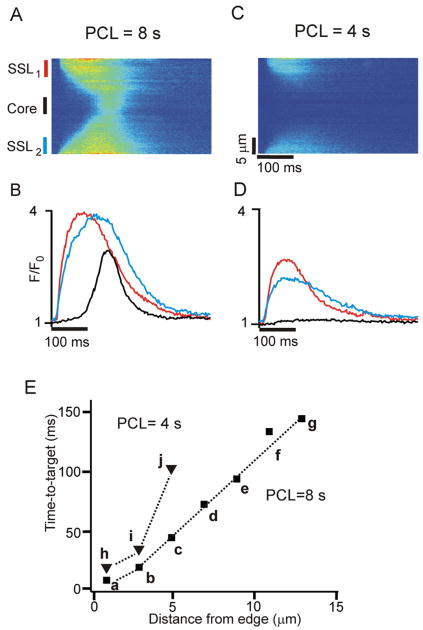
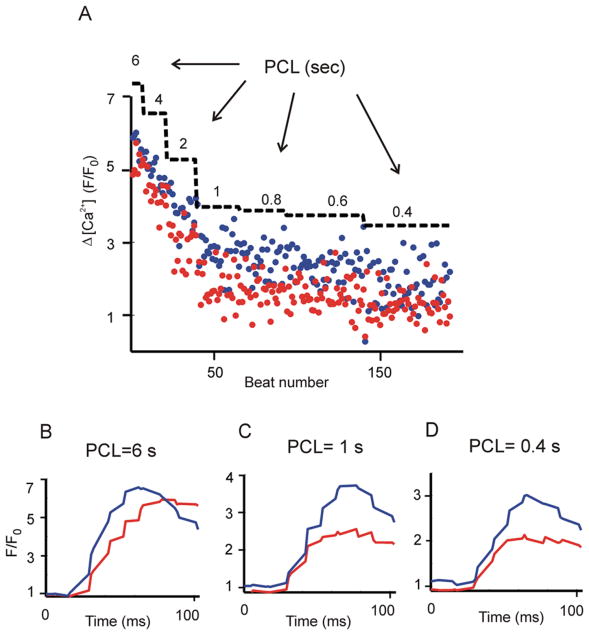
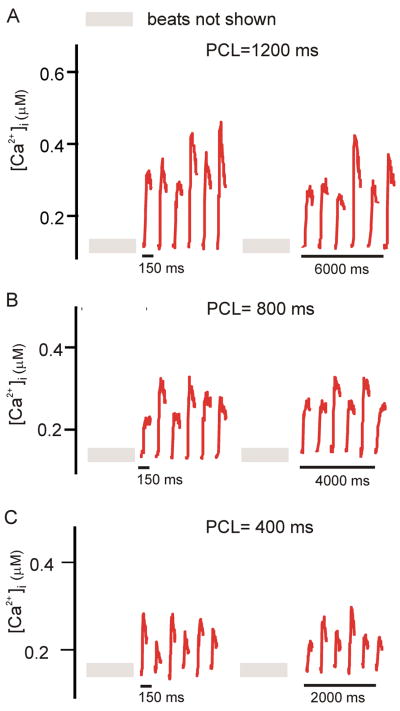
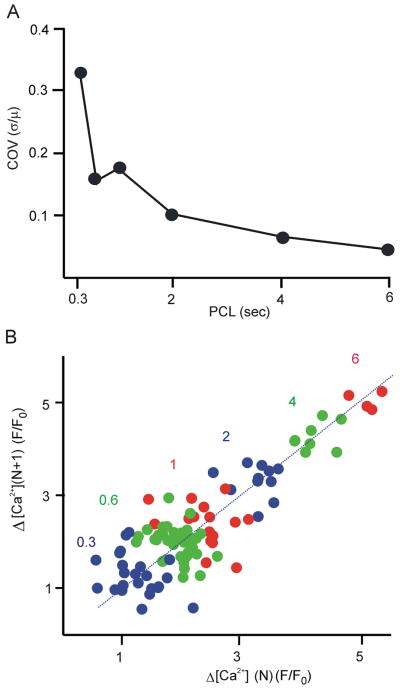
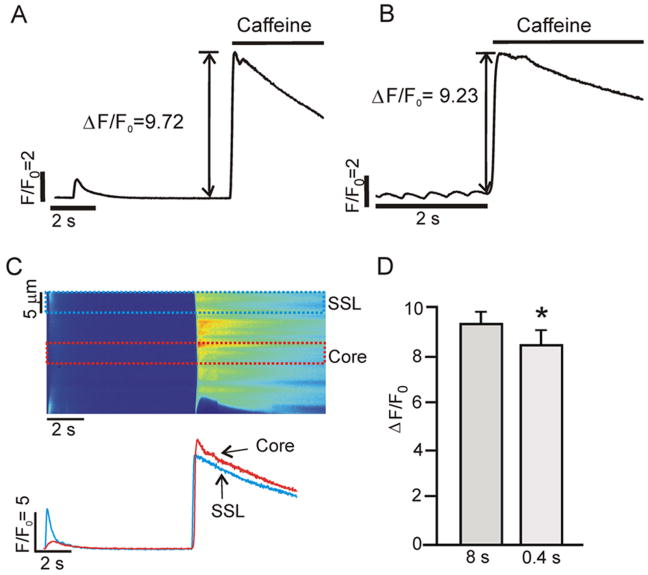
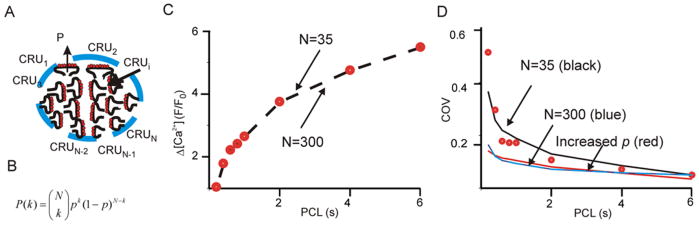
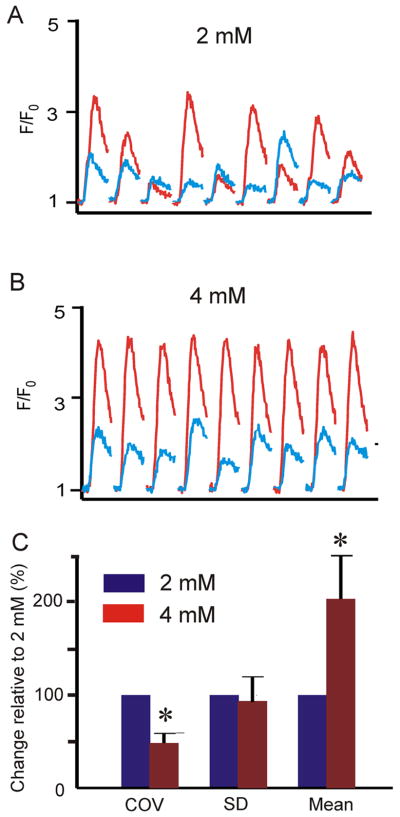
Purkinje fibers play an essential role in transmitting electrical impulses through the heart, but they may also serve as triggers for arrhythmias linked to defective intracellular calcium (Ca(2+)) regulation. Although prior studies have extensively characterized spontaneous Ca(2+) release in nondriven Purkinje cells, little attention has been paid to rate-dependent changes in Ca(2+) transients. Therefore we explored the behaviors of Ca(2+) transients at pacing rates ranging from 0.125 to 3 Hz in single canine Purkinje cells loaded with fluo3 and imaged with a confocal microscope. The experiments uncovered the following novel aspects of Ca(2+) regulation in Purkinje cells: 1) the cells exhibit a negative Ca(2+)-frequency relationship (at 2.5 Hz, Ca(2+) transient amplitude was 66 ± 6% smaller than that at 0.125 Hz); 2) sarcoplasmic reticulum (SR) Ca(2+) release occurs as a propagating wave at very low rates but is localized near the cell membrane at higher rates; 3) SR Ca(2+) load declines modestly (10 ± 5%) with an increase in pacing rate from 0.125 Hz to 2.5 Hz; 4) Ca(2+) transients show considerable beat-to-beat variability, with greater variability occurring at higher pacing rates. Analysis of beat-to-beat variability suggests that it can be accounted for by stochastic triggering of local Ca(2+) release events. Consistent with this hypothesis, an increase in triggering probability caused a decrease in the relative variability. These results offer new insight into how Ca(2+) release is normally regulated in Purkinje cells and provide clues regarding how disruptions in this regulation may lead to deleterious consequences such as arrhythmias.


Figures

Figure 1
Figure 1
Ca2+ waves occur at very low pacing rates; local subsarcolemmal (SSL) elevations in Ca2+ occur at higher pacing rates. (A) Space-time line scan image obtained at PCL = 8 s shows an early increase in [Ca2+] in SSL regions and a delayed increase in the core. (B) Local Ca2+ transients averaged over 5 μm at two SSL regions (red and blue) and in cell core (black), as indicated to the left of the image in (A). (C) and (D) Space-time image and local Ca2+ transients, respectively, obtained in the same cell at PCL = 4 s. Electrical stimulation induces elevations in Ca2+ only in the SSL regions. (E) Time-to-target plot of activation time versus distance from cell edge, with Ca2+ transients averaged over each 2 μm region.
Figure 2
Figure 2
Purkinje cells exhibit a negative Δ[Ca2+] versus frequency relationship. A single Purkinje cell was paced with a protocol in which the PCL was progressively decreased and Ca2+ transients resulting from each stimulation were recorded. (A) Local SSL Ca2+ transients recorded from two edges of a cell. Amplitudes (Δ[Ca2+]= Peak−diastolic [Ca2+]) calculated at the two SSL regions are denoted by red and blue circles. PCLs are superimposed as a staircase to mark each cycle length regime. (B-D) Averaged SSL [Ca2+] transients at PCL= 6 s (B), 1 s (C), 0.4 s (D). All data were obtained at the same scan line in an individual cell.
Figure 3
Figure 3
Beat-to-beat variability in the local SSL persists with steady pacing. (A), (B), and (C), respectively, show SSL Ca2+ transients at PCL=1200, 800, and 400 ms. Each panel shows two sets of six consecutive Ca2+ transients, the first obtained after 29 stimuli, and the second obtained after 23 additional stimuli. At each PCL, variability in SSL Ca2+ transient amplitude persists.
Figure 4
Figure 4
Faster pacing leads to an increase in the normalized Ca2+ transient variability, but an irregular pattern from one beat to the next. (A) Coefficient of variation (COV) in SSL Ca2+ transient amplitude, computed in a single cell as the standard deviation divided by the mean, and plotted as a function of PCL. (B) Map of SSL Ca2+ transient amplitude on the current beat versus amplitude on the next beat at several different PCLs as indicated.
Figure 5
Figure 5
SR Ca2+ load during slow and fast pacing. (A) Example showing the increase in cytosolic [Ca2+] produced by rapid application of 20 mM caffeine after pacing at PCL = 8s. (B) Increase in cytosolic [Ca2+] in the same cell after pacing at 0.4 s. (C) Space time image of the response to caffeine at PCL = 8 s (top), and SSL and core Ca2+ transients (5 μm average; bottom). (D) Pooled data (n=10 cells) illustrating that SR Ca2+ load, approximated as ΔF/F0 induced by 20 mM caffeine, is slightly lower at PCL = 0.4 s than at PCL = 8 s (8.41 ± 0.63 versus 9.30 ± 0.52; p = 0.03).
Figure 6
Figure 6
Results of simple mathematical model. (A) Diagram of N Ca2+ release units (CRUs). During an action potential each unit has a probability of p to be triggered and generate an event with amplitude A. (B) Assuming that triggering from each CRU is an independent event, the kth term of the binomial distribution describes the probability that k events are triggered. (C) Dots show the relationship between Ca2+ transient amplitude (averaged at one SSL of a cell) and PCL. The model can fit the data perfectly (dashed line) assuming either many release units, each with small amplitude (N=300), or fewer release units, each with larger amplitude (N=35). (D) COV data (black dots) from the same cell were compared with model results of N=35 (black solid line), N=300 (black dashed line) and N=35 with a 50% increased probability p (blue dashed line).
Figure 7
Figure 7
An increase in triggering of Ca2+ release causes a decrease in relative Ca2+ transient variability. (A) [Ca2+] transients at two SSL regions with [Ca2+]o = 2 mM. (B) [Ca2+] transients measured from the same locations in the same cell with [Ca2+]o = 4 mM. (C) Pooled data (n=6 cells) illustrating that increasing [Ca2+]o causes a significant (p = 0.005) increase in mean SSL Ca2+ transient amplitude and a significant (p < 0.001) decrease in COV. Average COV at 4 mM is 49 ± 11% of the value at 2 mM. For these statistical comparisons, we treated the two SSL regions in each cell as independent events such that n=6 cells generated a total of n=12 data pairs for comparison.

Similar articles

Cited by

References

    1. Boyden PA, Hirose M, Dun W. Cardiac Purkinje cells. Heart Rhythm. 2010;7(1):127–35. - PubMed
    1. Bogun F, Good E, Reich S, Elmouchi D, Igic P, Tschopp D, et al. Role of Purkinje fibers in post-infarction ventricular tachycardia. J Am Coll Cardiol. 2006;48(12):2500–7. - PubMed
    1. Cerrone M, Noujaim SF, Tolkacheva EG, Talkachou A, O’Connell R, Berenfeld O, et al. Arrhythmogenic mechanisms in a mouse model of catecholaminergic polymorphic ventricular tachycardia. Circ Res. 2007;101(10):1039–48. - PMC - PubMed
    1. Boyden PA, Pu J, Pinto J, Keurs HE. Ca2+ transients and Ca2+ waves in purkinje cells : role in action potential initiation. Circ Res. 2000;86(4):448–55. - PMC - PubMed
    1. Boyden PA, Barbhaiya C, Lee T, ter Keurs HE. Nonuniform Ca2+ transients in arrhythmogenic Purkinje cells that survive in the infarcted canine heart. Cardiovasc Res. 2003;57(3):681–93. - PMC - PubMed

Publication types